Ethereum: What investors need to do if this trend changes

After weeks of rallying, for the first time yesterday, Ethereum registered some changes in its price movement. In fact, the same was the case with Bitcoin as while it dropped to $46k, Ethereum touched $3200.
Ethereum to fall back down?
Not completely. Since the second-generation cryptocurrency has rallied by almost 80% over the last few weeks, it only makes sense that along the way, some corrections would start appearing. In keeping with the same, ETH went down by 5% yesterday, registering its highest single-day drop since 8 July.
However, more noteworthy was the Parabolic SAR that moved its position to above the candlesticks for the first time in a month. This is a sign of a downtrend being initiated in the market.
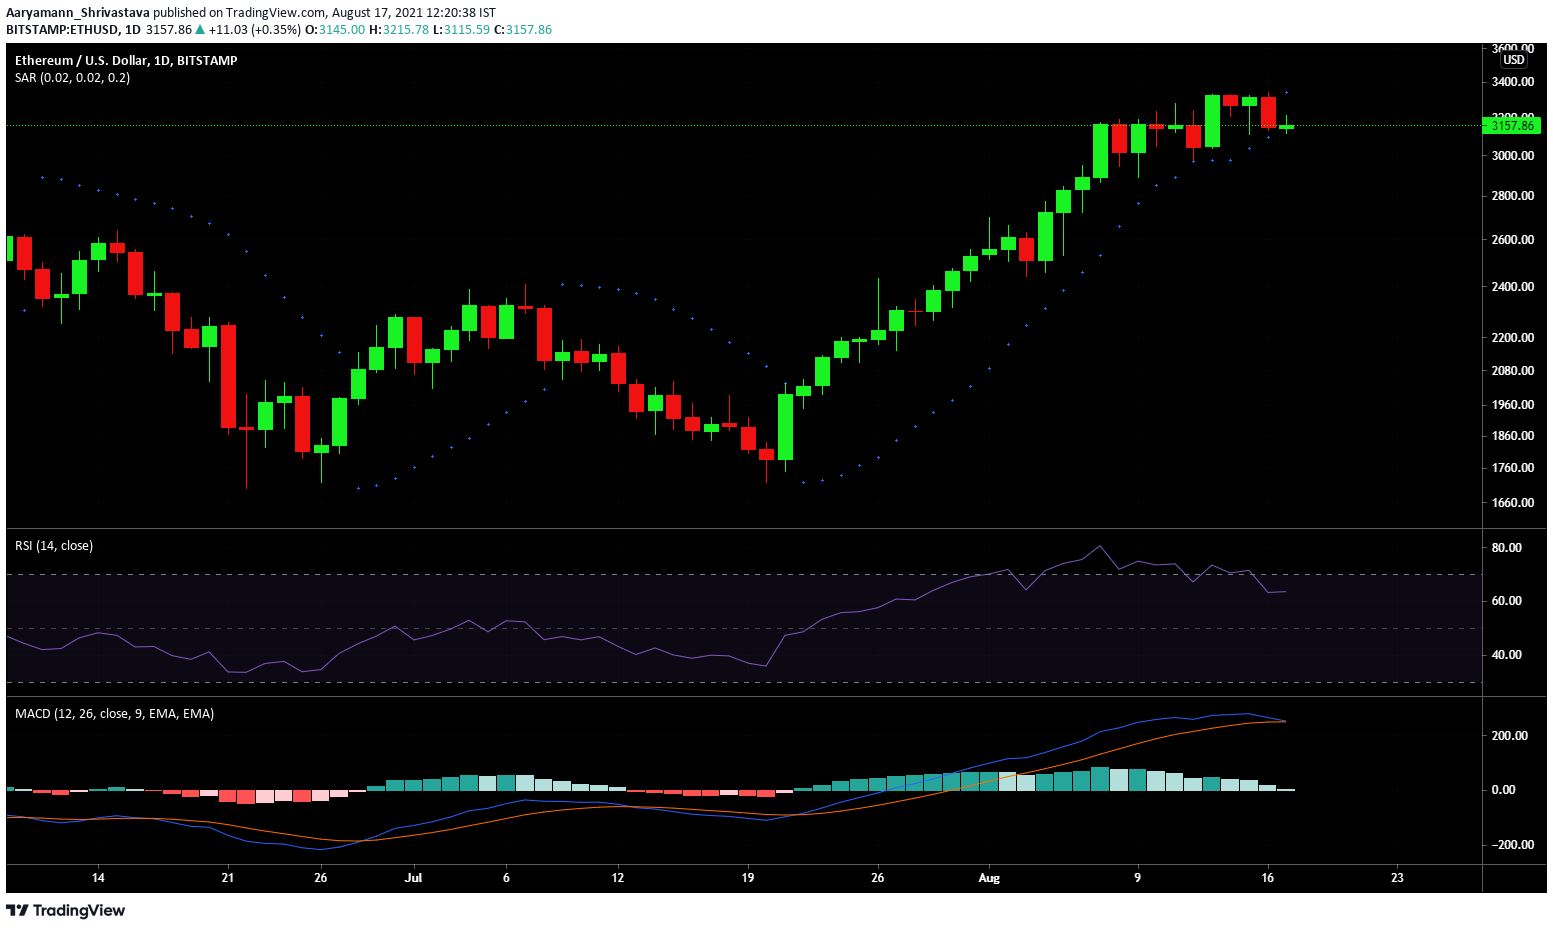
Additionally, the Relative Strength Index (RSI) has been falling too as the MACD pictured a bearish crossover on the way. These are strong indicators of a correction. However, investors have been preparing for this way before these signs even began appearing.
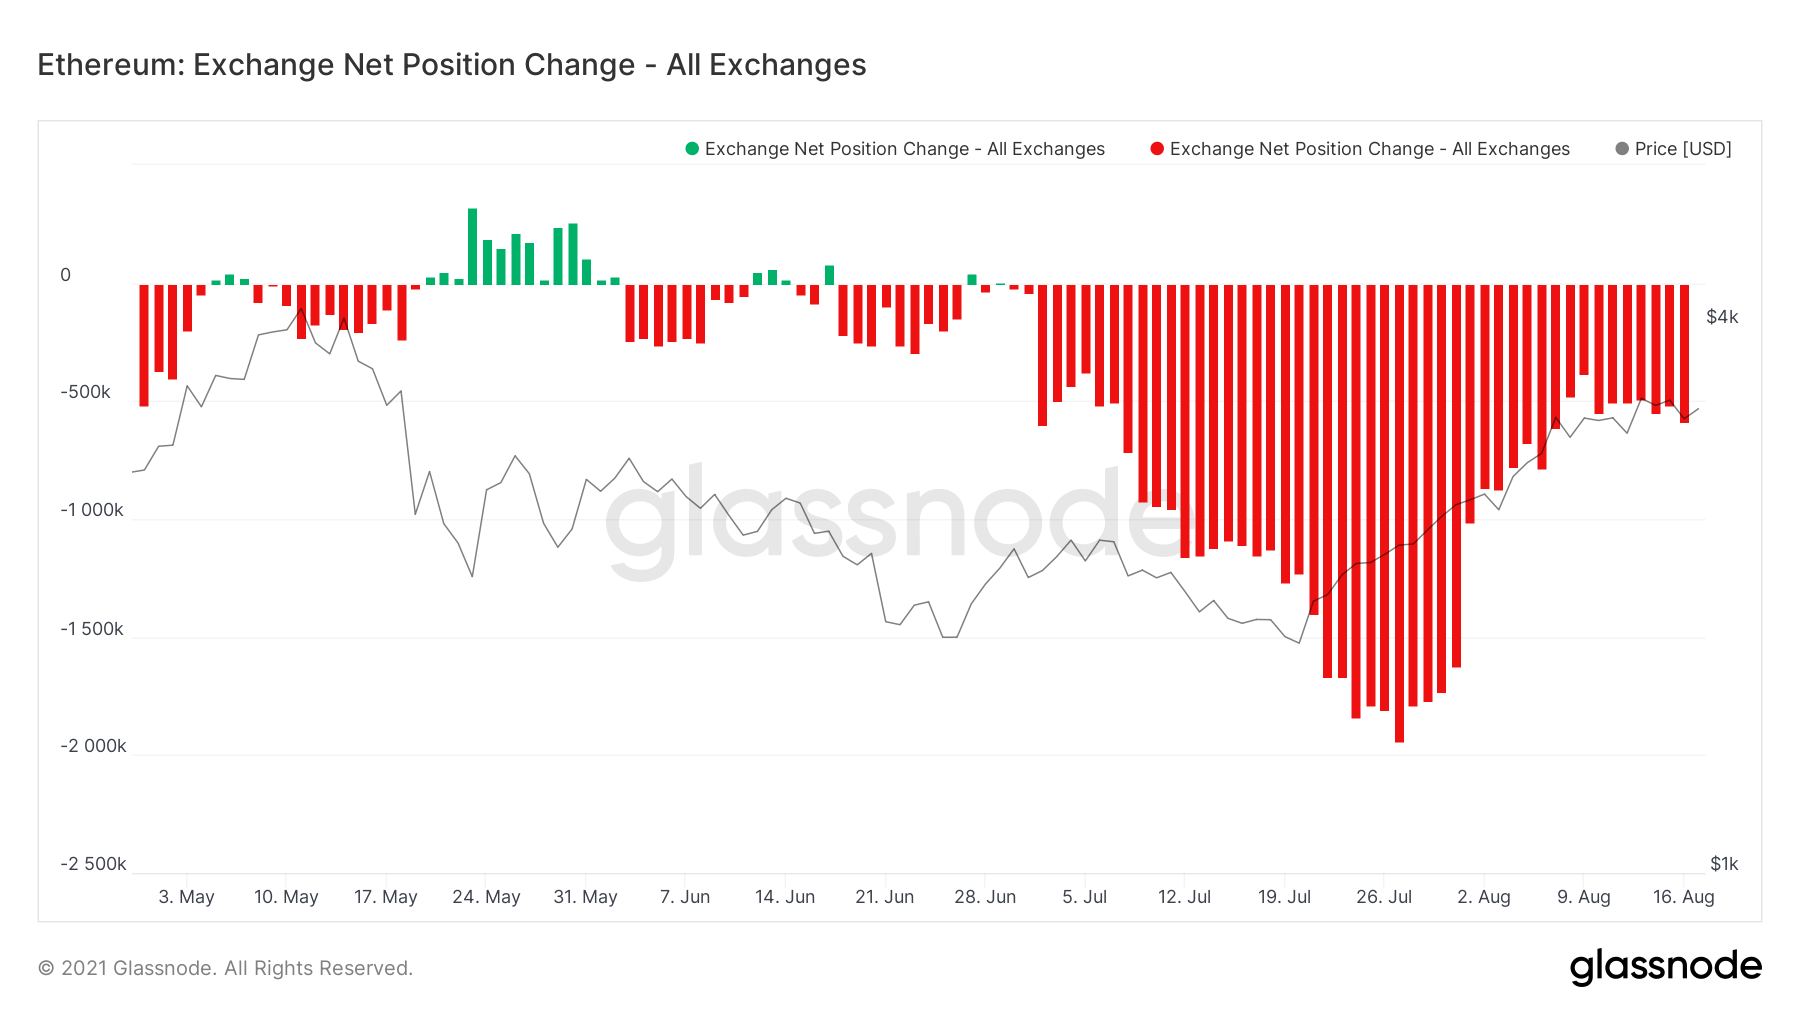
Selling began earlier and as of now, over $4.4 billion worth of 1.4 million ETH has flowed back into exchange wallets. Surprisingly, however, at the time of writing, this trend had changed once again.
What are investors doing now?
At the moment, investors are back to HODLing. During corrections, people usually sell majorly, but because those corrections aren’t apparent at the moment, they are back to buying more ETH.
This is an effect of the recent rally, one where everyone observed the potential of profits. And if in the future a rally occurs, after a substantial period of sideways movement, they could take out profits.

This assertion can be backed by the Bid-Ask spread chart which showed the buy orders and sell orders and the average price they were placed at. The spread, at press time, showed higher demand for buying than selling, at least 11,000 ETH higher buying.

Finally, the Spent Output Profit Ratio, a metric that shows if the market is bullish or bearish, is also dropping. This comes after the indicator touched a 3-month high of 1.11. In conclusion, as an investor, don’t expect Ethereum to turn overtly bearish. However, preparing for some price falls would be wise.