Ethereum: Why HODLing could be your best bet in April
Wallets with less than 1 Ethereum were increasingly HODLing alongside a section of ETH whales.

- Ethereum saw healthy growth in on-chain activity.
- Ethereum shrimp and plankton refused to sell their holdings.
Ethereum [ETH] rallied by 82% from 1st February to 12th March. Since then, it has retraced as low as $3056 before bouncing higher, trading at $3533 at press time. This resembled the consolidation phase in the second half of January.
AMBCrypto examined some relevant metrics and found a few similarities. These hints highlighted a bullish bias and a healthy network overall.
The peaks in volume and active addresses
Ethereum rallied from $1521 to $2717 from 12th October 2023 to 12th January, a 78% move. It retraced for close to three weeks before breaking above the lower timeframe resistance at $2380.
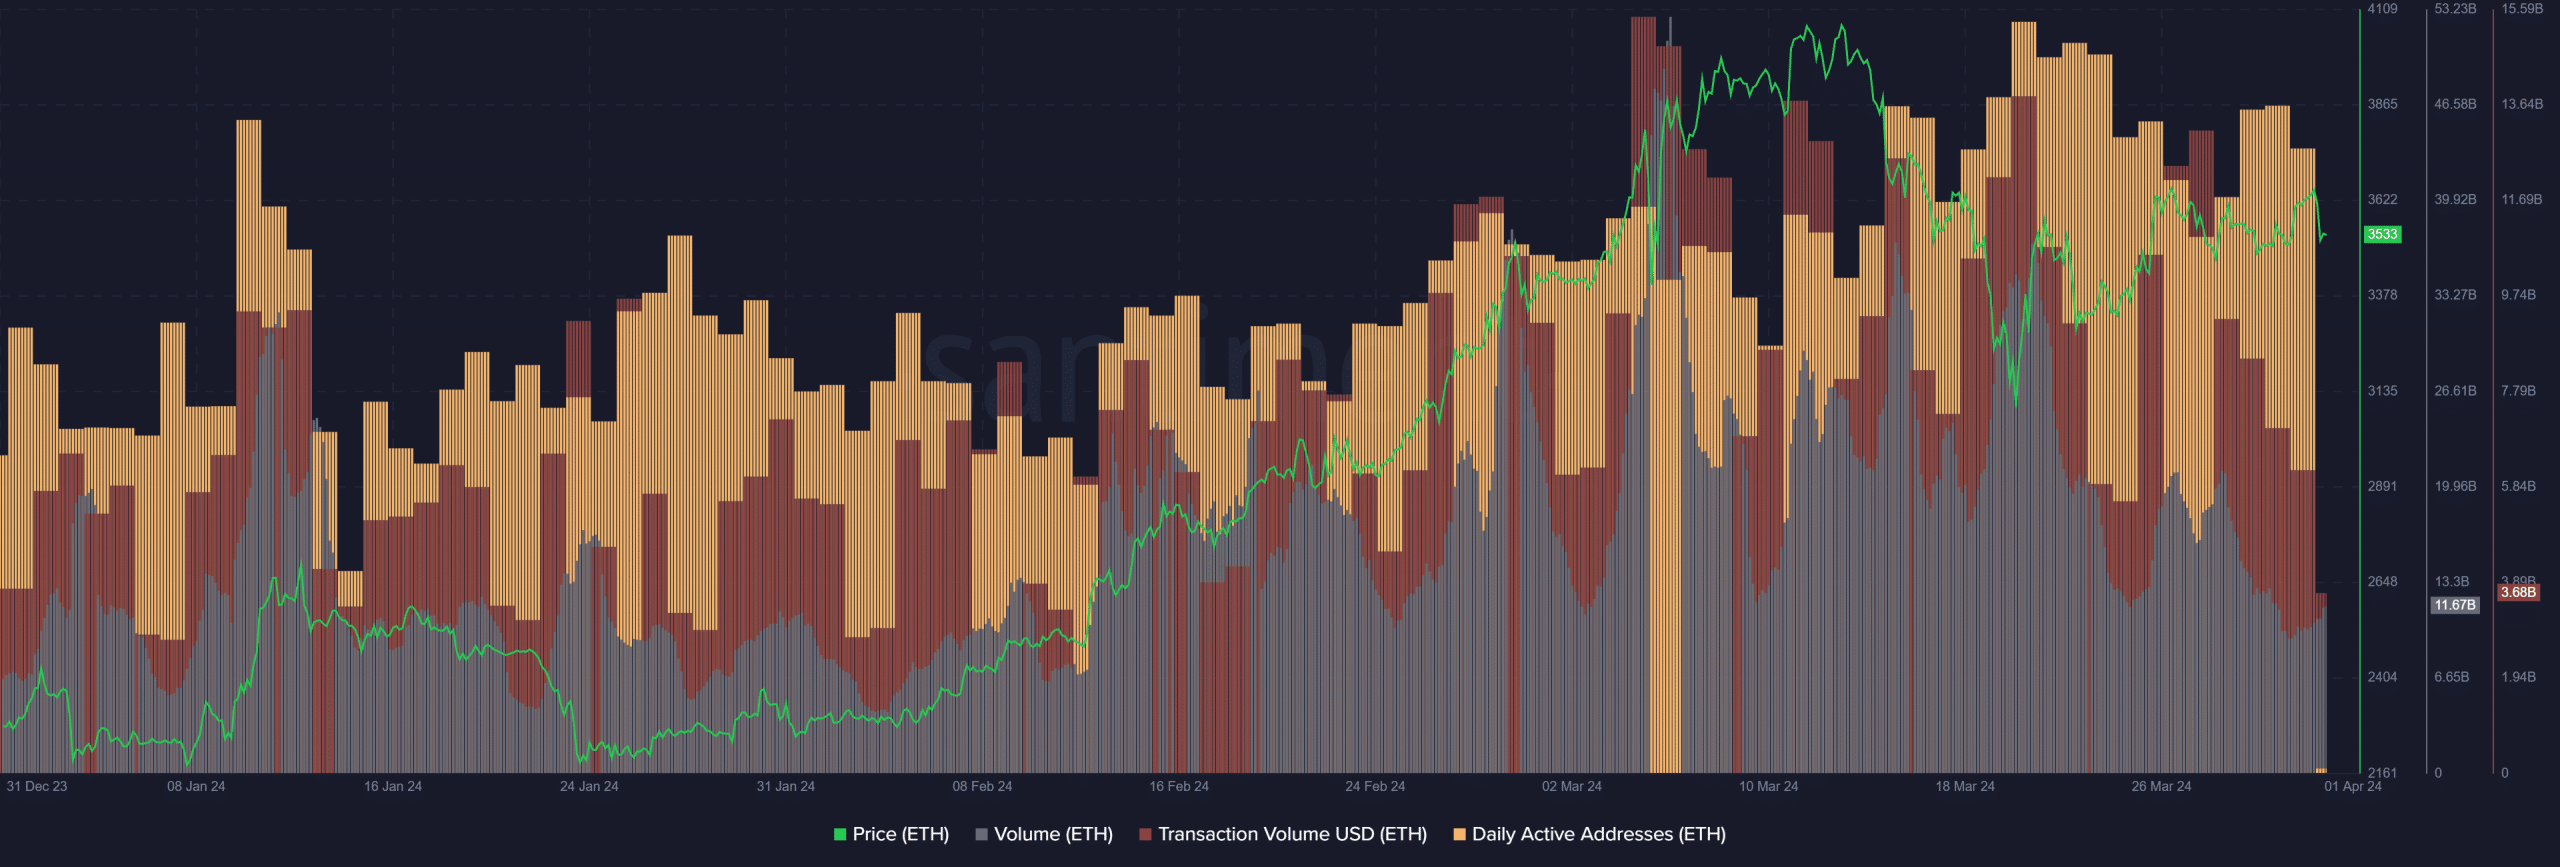
Just before the ETH price slump, the trading volume peaked to levels not seen in over six months. The daily active addresses also shot upward, nearly reaching September 2023’s highs.
The surge in activity was understandable as bullish sentiment was intense. This spurred increased demand for ETH and drew in more participation. During the retracement, the daily active addresses remained high.
The trading volume, on the other hand, slumped drastically. This was quite similar to what happened over the past three weeks. In March, the daily active addresses made new highs even after prices plunged to the $3100 mark.
Meanwhile, the on-chain transaction volume formed a local peak during the January and March highs. The retracement period saw a brief decline in the transaction volume, followed by a quick recovery.
The transaction volume of the past week was low, but otherwise, the metrics closely mirrored what happened in the latter half of January.
This comes alongside ETH bulls forcing a quick recovery after falling to $3056. We might see a bullish continuation in April as we did in February.
The supply distribution showed whales were buying
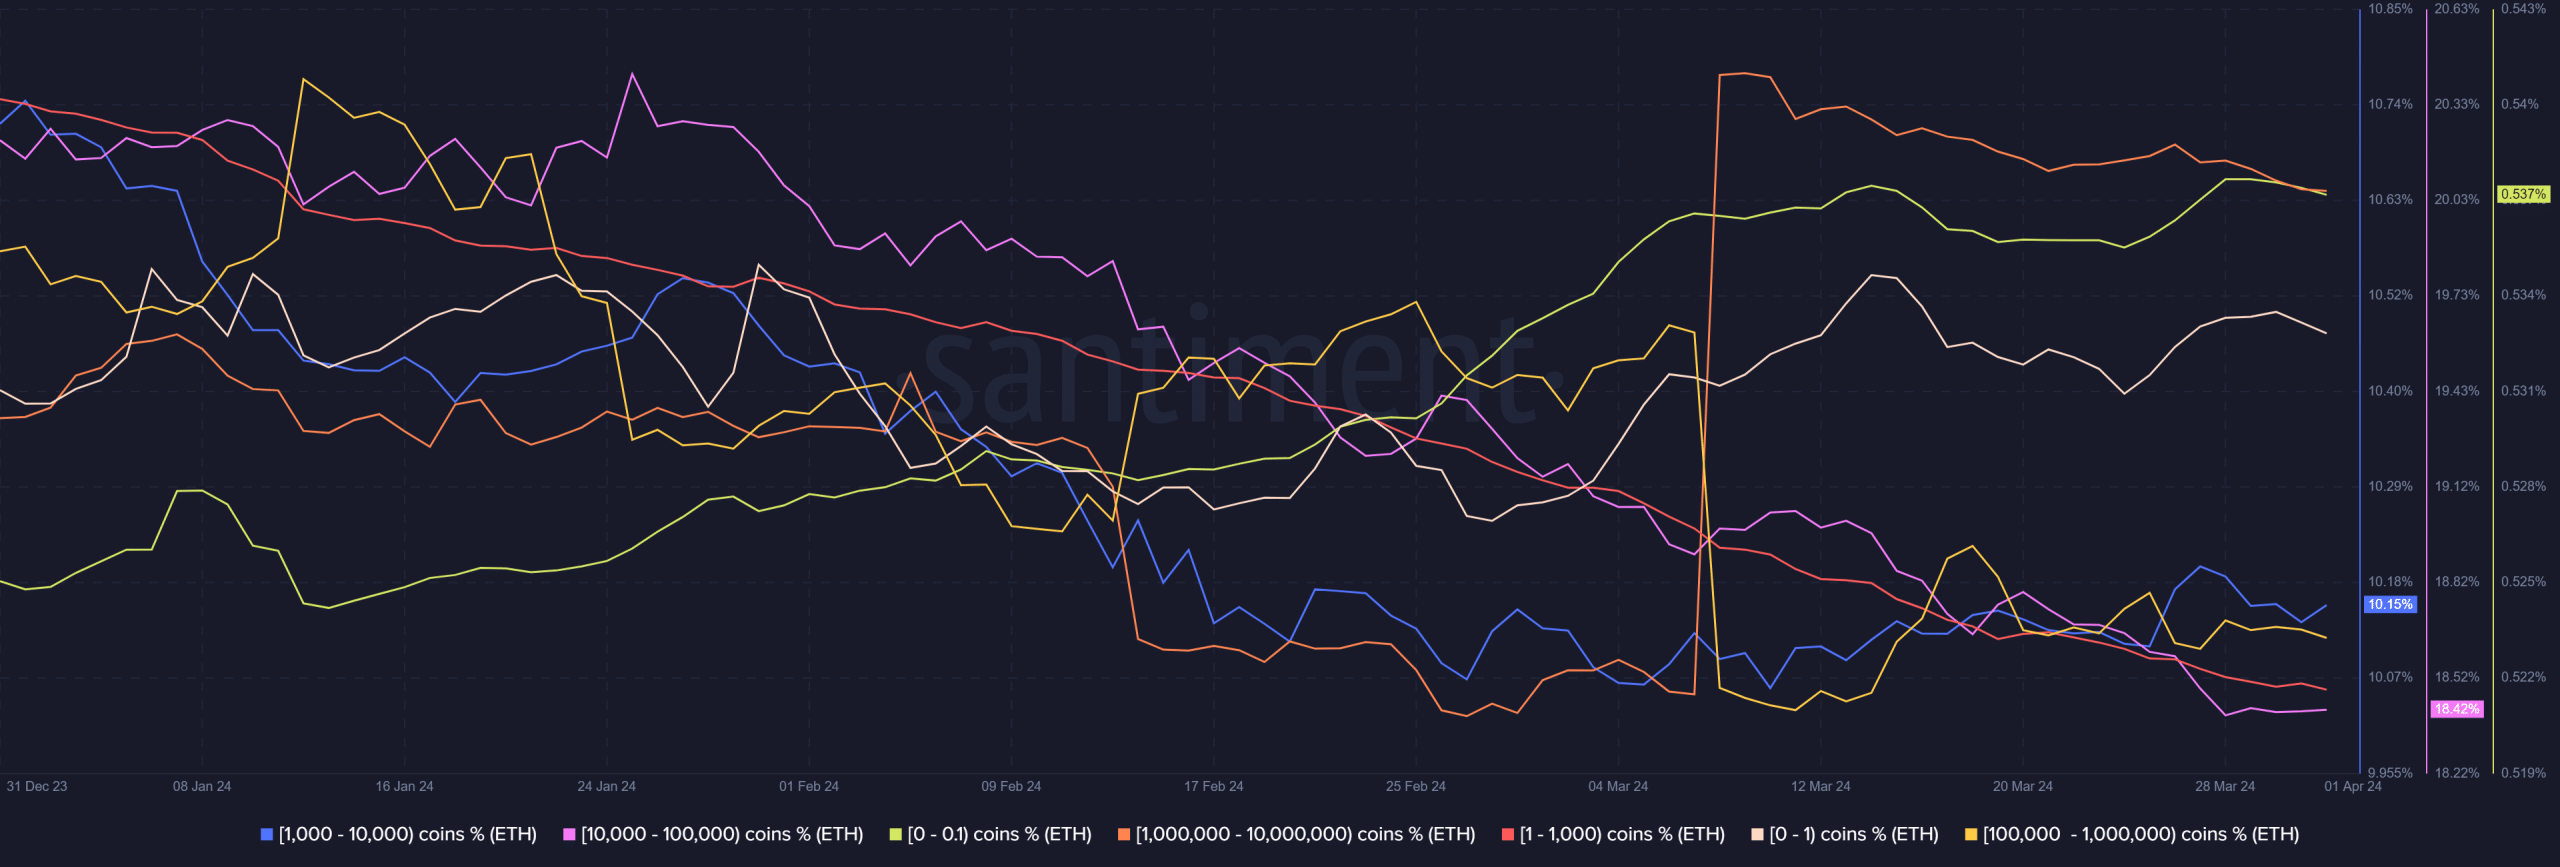
When smaller holders sell their assets to whales, it is typically a bullish sign. The Ethereum supply distribution chart showed this but with a caveat. Wallets with 1k to 10k ETH and 100k to 1 million ETH slowly trended higher after 12th March.
Is your portfolio green? Check the ETH Profit Calculator
Shrimp holders also grew, such as those with fewer than 0.1 or 1 Ethereum. The 1 to 1k bracket shrunk steadily. This showed that medium-sized holders were selling their holdings while whales and shrimp alike continued to accumulate the assets.
The 10k-100k ETH bracket also trended downward, which went against the bullish inference. It showed that accumulation and distribution were not black and white, but small ETH holders were increasingly HODLing.


