
SEC delays decision on Trump’s Truth Social Bitcoin ETF – Details inside!

World Computer aka Ethereum’s rapid descent in price seems to be slowing down as it has been consolidating for over two months now. The price of ETH hovers at $184 with a market cap of $20 billion making it the second-largest cryptocurrency in the world. As the price has breached a longterm bullish pattern, longs have the stage to prove their credence.
With the upcoming Istanbul hard fork on December 04, the currency seems to be gearing up for a stormy couple of weeks during and after the implementation. This hard fork is the crypto’s morph into Ethereum 2.0.
4 Hour
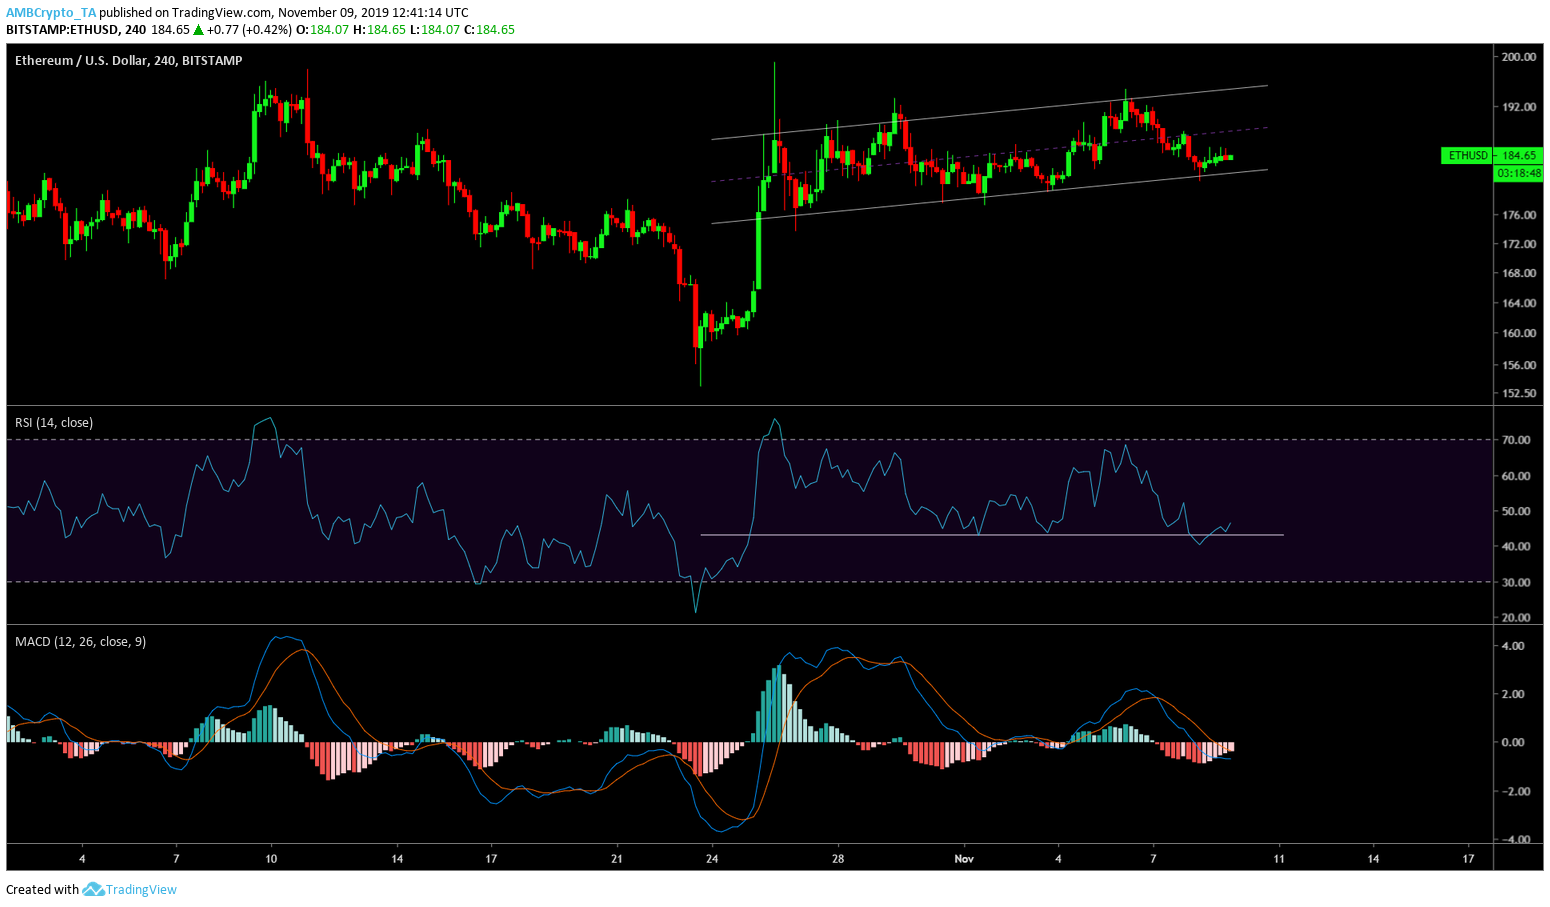
Source: ETH/USD TradingView
The four-hour chart for ETH showed the formation of a short-term bearish ascending channel. The price was near the end of the channel indicating an imminent breakout. Moreover, RSI indicator is also sitting on support at 43.16, breaching this would mean RSI would drop to 15-day low on the four-hour chart. If the following is to happen in the future it would further amplify the bearish case for the ascending triangle. The MACD indicator showed that it is aiming for a bullish crossover.
Daily Chart
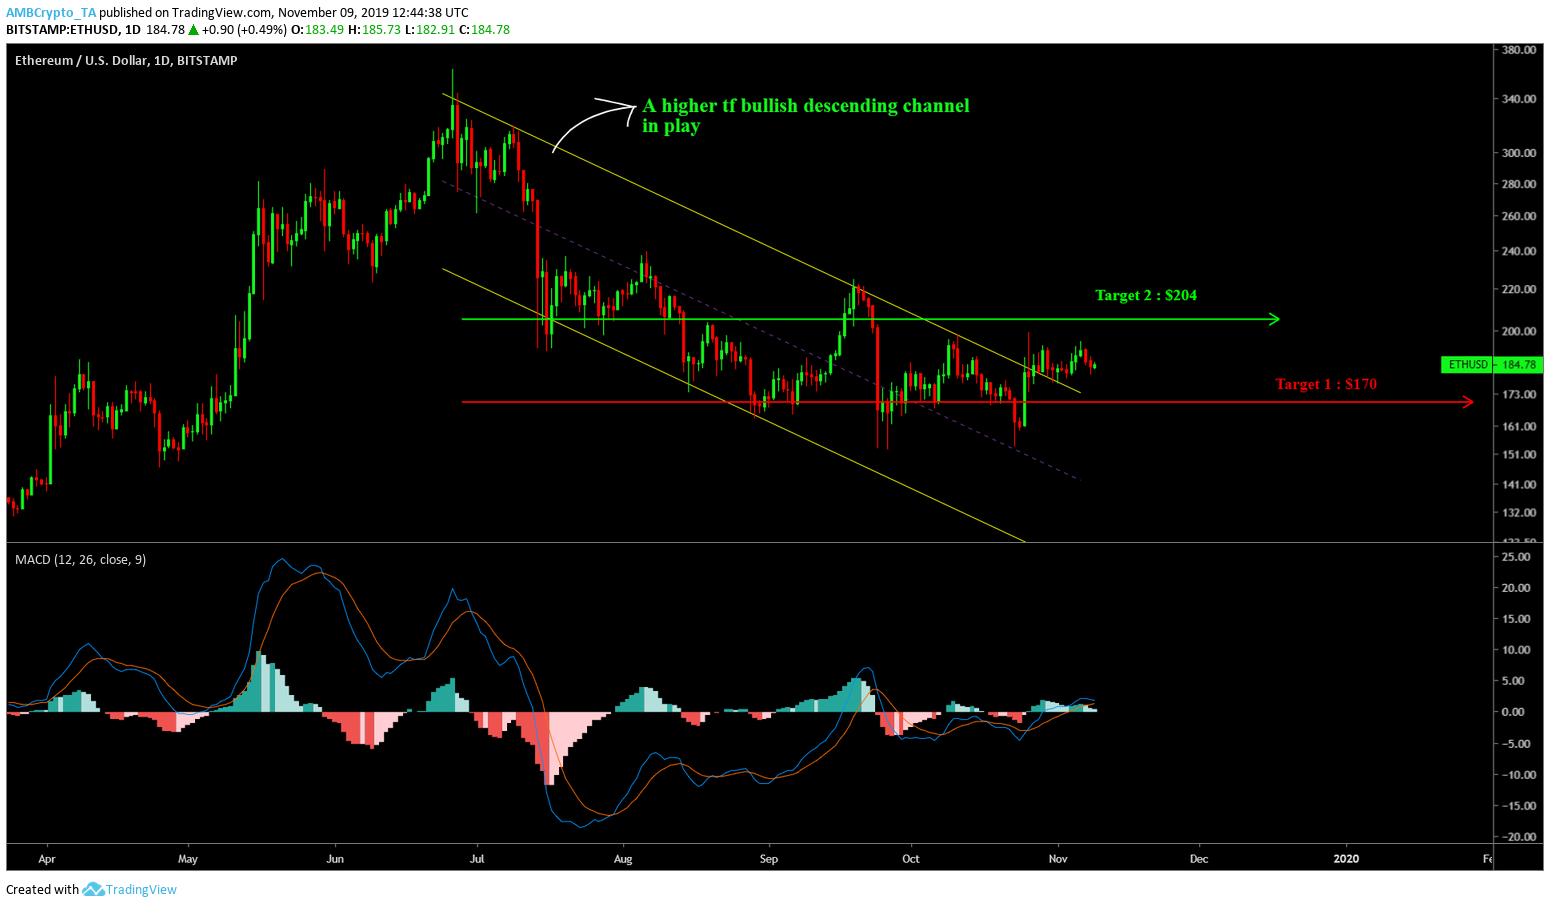
Source: ETH/USD TradingView
Ethereum’s daily chart indicated an opposing view of the above, i.e., bullish. The price has broken out of the descending channel after being in it for over 120 days. The breakout, although recent needs to retest the upper band of the descending channel to be bullish. If the same does not happen and the price breaches into the pattern, this would mean the bullish play will be put on hold. However, if the momentum is enough, the price might continue its uptrend.
The most likely of the above three scenarios is the retest on the upper band of the descending channel. This would mean that the price, which was at $184, would have to come back to $170 and then head back to $204, which will be the new short term target for ETH. Looking at the Fibonacci retracement, the above-mentioned levels would be 0.5 Fibonacci [$170] and 0.618 Fibonacci level [$204].
Correlation
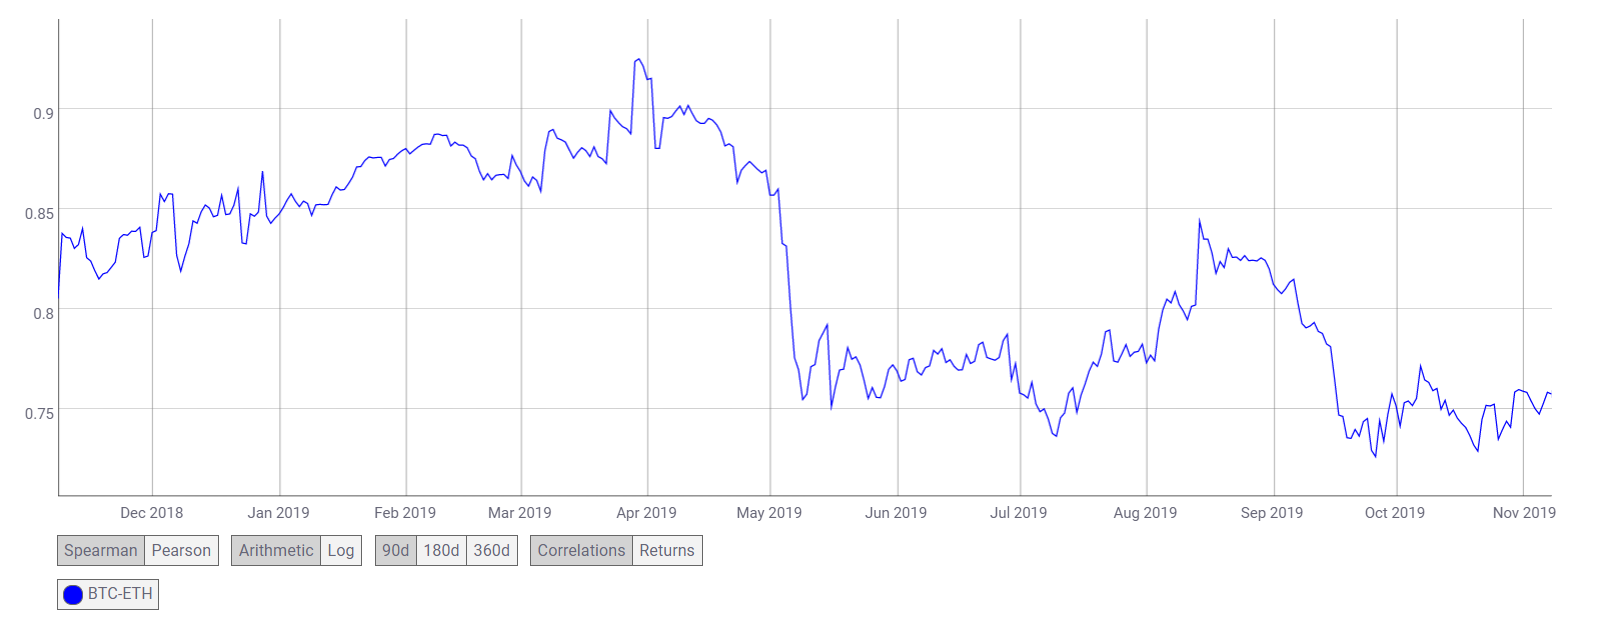
Source: Coinmetrics.io
Further bullish momentum for Ethereum depends on its correlation to Bitcoin. If there’s sudden bearish momentum with Bitcoin during times of high correlation, ETH could sway in that direction as well.
At press time, the 90-day Spearman correlation for ETH and BTC has reduced to 0.7572, this is good for Ethereum. Although correlation does not always imply causation, this reduction in correlation from a recent high of 0.925 indicates that BTC’s sudden volatility induced movements would affect ETH slightly less.
Conclusion
The second-largest cryptocurrency seems bearish in the short term but is uber bullish in the long term. The following are the targets for ETH,
- $170
- $204
- $270
All of the above-mentioned targets depend on the momentum with which the breakout proceeds. If there is enough momentum reaching $265 to $270 wouldn’t be a difficult target for ETH.


