Ethereum
Ethereum’s big hint: Last chance to buy ETH at $3,500?
Altcoins were following a historical pattern that hinted at a bull rally for Ethereum.


- Ethereum’s price declined by more than 3% in the last 24 hours.
- A key indicator suggested that ETH was near its market bottom.
Ethereum [ETH] bears continued to dominate the market as the token’s weekly chart remained red.
However, the entire situation can change, as the latest data revealed that this might be the last stage of the accumulation phase for altcoins.
Since Ethereum is the world’s largest altcoin, the chances of ETH gaining bullish momentum seemed likely.
Last chance to buy ETH
CoinMarketCap’s data
revealed that ETH’s price dropped by more than 3% in the last seven days. At the time of writing, the king of altcoins was trading at $3,553.33 with a market capitalization of over $426 billion.Meanwhile, Milkybull, a popular crypto analyst, posted a tweet highlighting how altcoins were following its 2020 trend, which resulted in a massive altcoin season then.
In 2020, the altcoin market cap broke out of a pennant pattern, initiating a bull rally. A similar pattern has once again emerged, hinting that this might be the last opportunity to buy alts, including Ethereum, at a lower price.
However, AMBCrypto’s analysis of Santiment’s data revealed that investors were not capitalizing on this opportunity.
We found that ETH’s exchange outflow declined over the last week. Additionally, its supply on exchange also increased, meaning that selling pressure on the token was high.
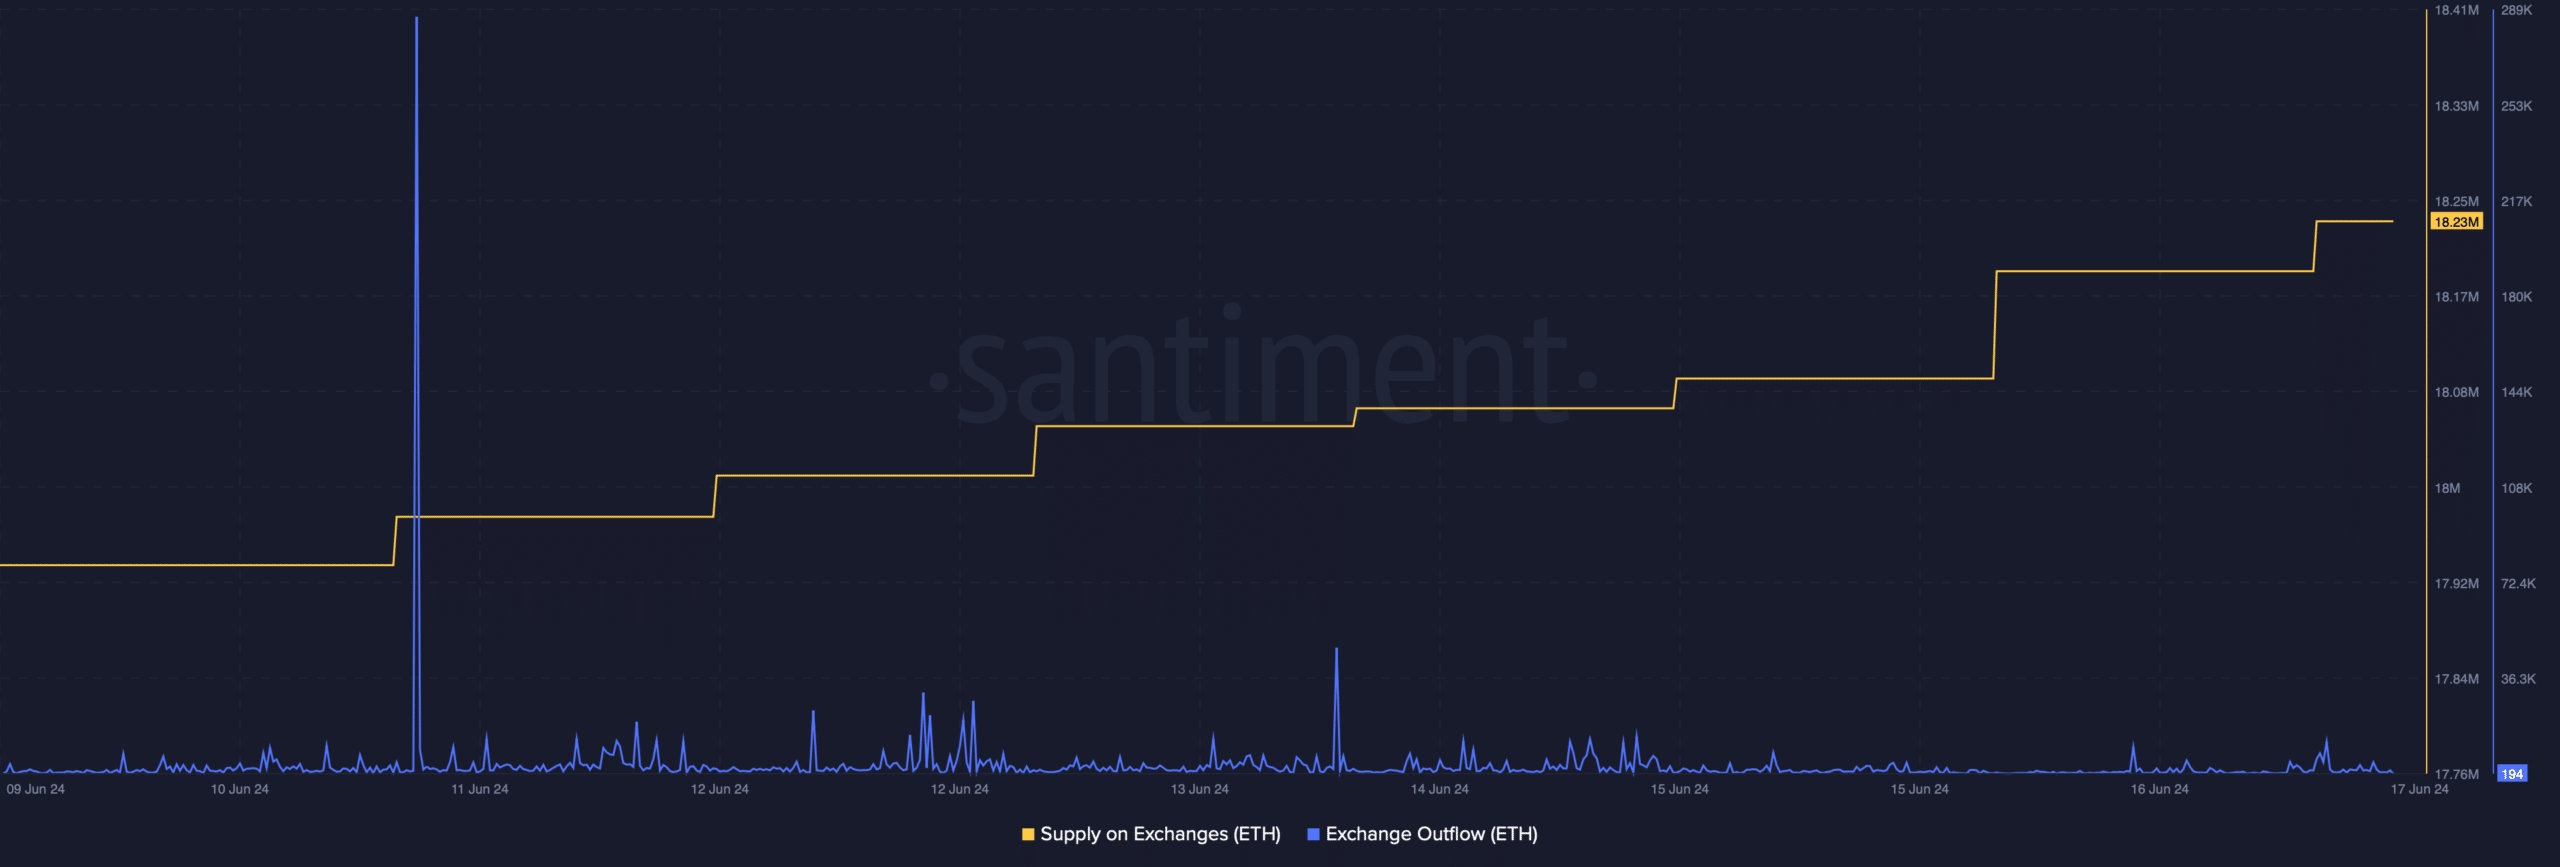
Source: Santiment
Is Ethereum awaiting a rally?
Since Milklybull’s analysis hinted at a bull rally, AMBCrypto then analyzed ETH’s on-chain data to see whether it supported the possibility of a price increase.
Ethereum’s Pi Cycle Top indicator revealed that ETH was resting near a market bottom, hinting at a price uptick.
If that happens, then ETH might soon reach $4.92k. For starters, the Pi Cycle indicators are composed of the 111-day moving average and a 2x multiple of the 350-day moving average of Ethereum’s price.
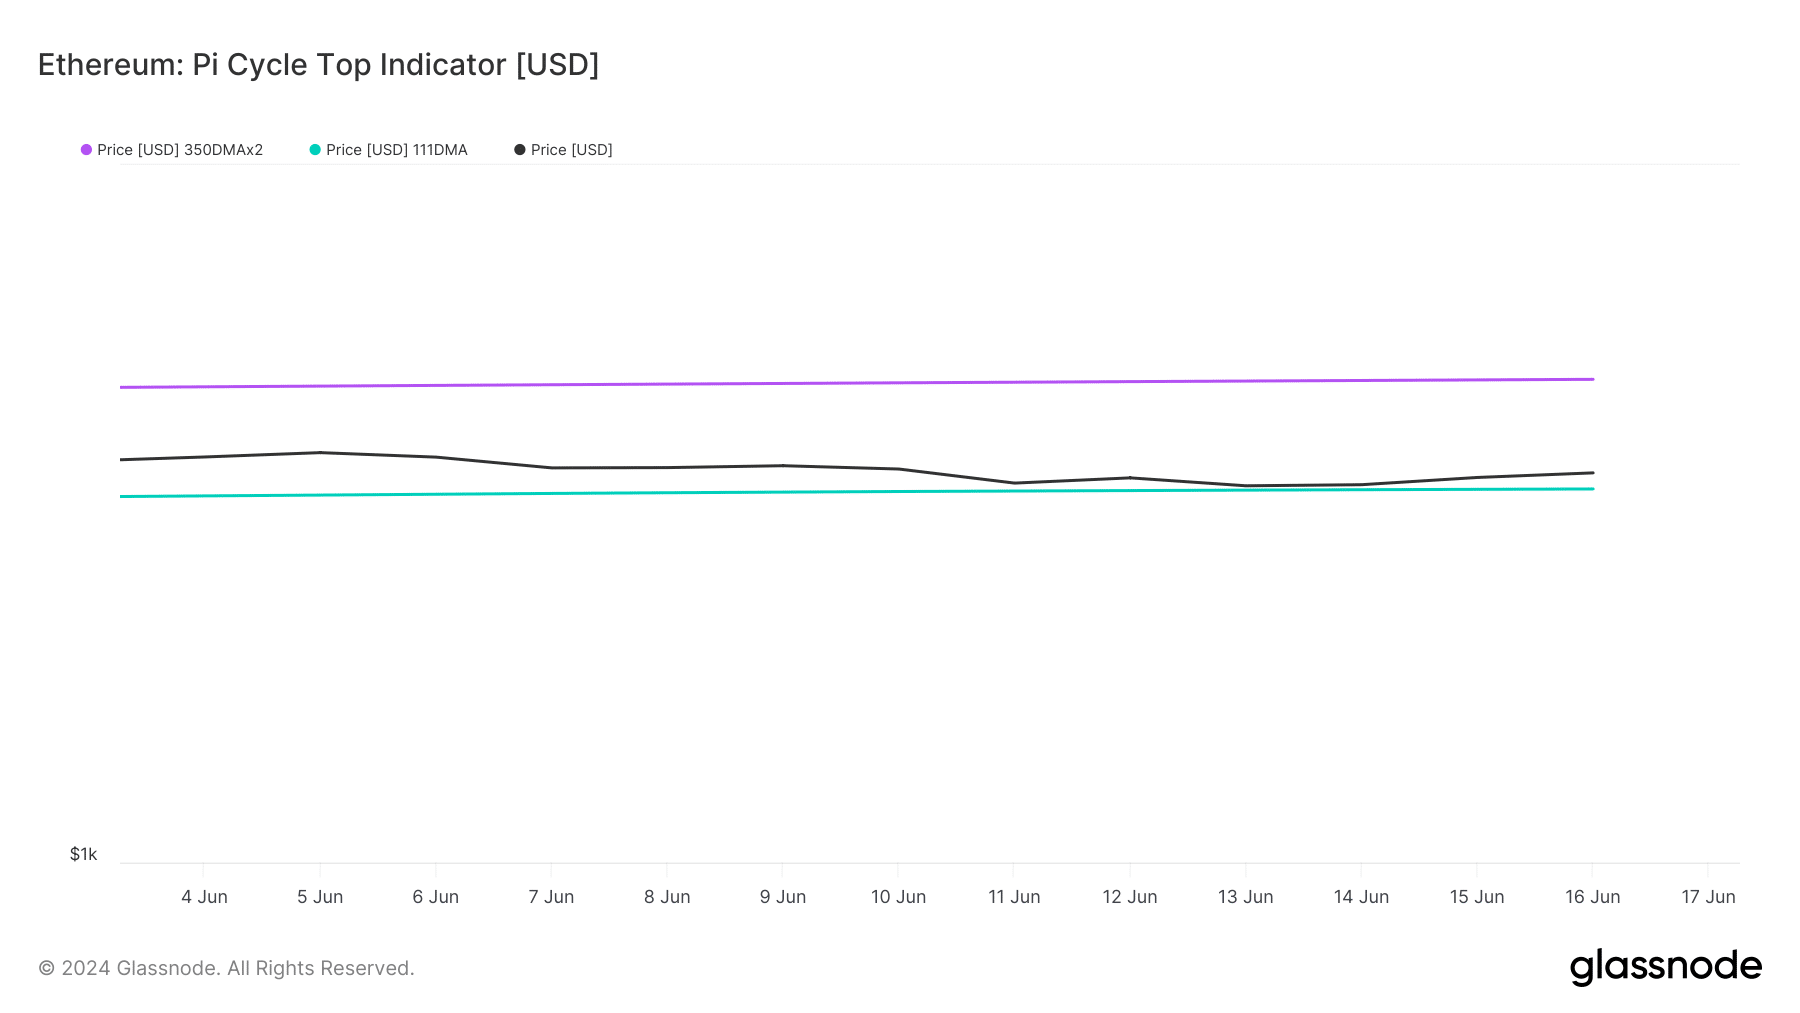
Source: Glassnode
The possibility of ETH gaining bullish momentum seemed high, as at press time the token’s fear and greed index had a value of 38%, meaning that the market was in a “fear” phase.
Whenever the metric reaches that level, it indicates that the chances of a bull rally are high. We then took a look at ETH’s 12-hour chart to better understand what to expect from the king of altcoins.
The technical indicator MACD displayed a bullish crossover.
Read Ethereum’s [ETH] Price Prediction 2024-2025
However, the rest of the indicators looked bearish. For instance, the Relative Strength Index (RSI) registered a downtick.
The Chaikin Money Flow (CMF) also followed a similar declining trend, suggesting that it might take a bit longer for ETH to begin a bull rally.
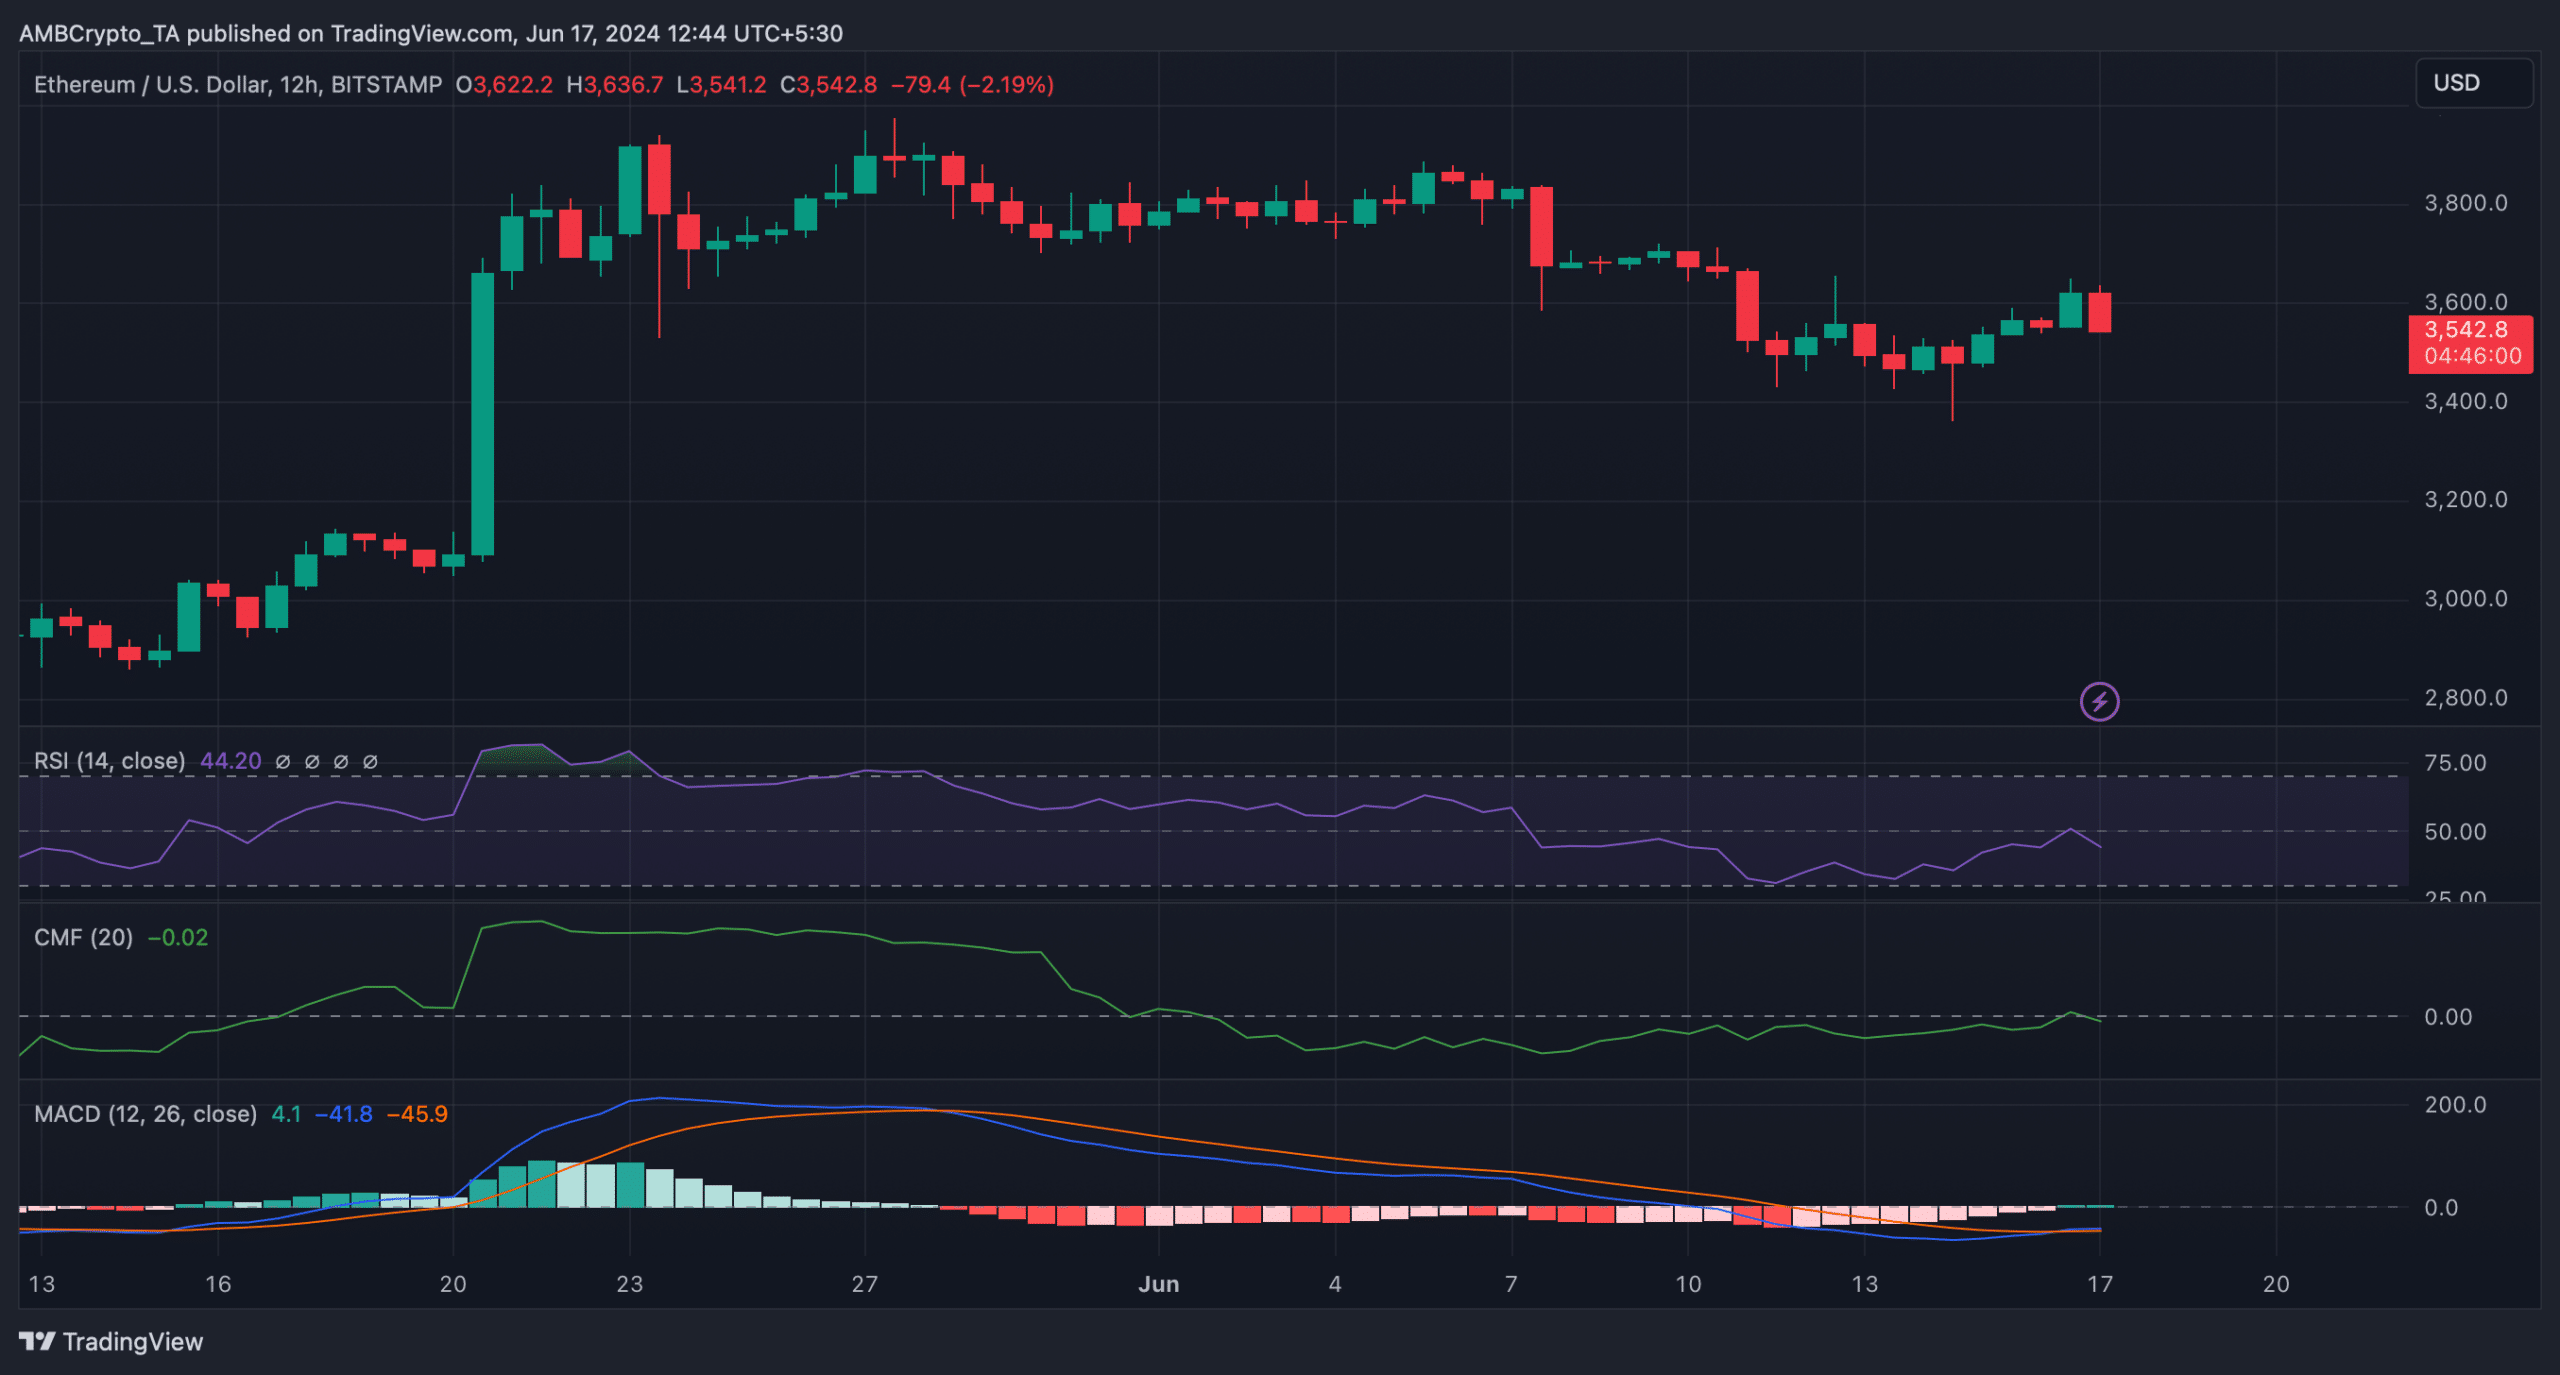
Source: TradingView