Ethereum’s bounce from $1550 encourages buyers, but is it a trap?

Disclaimer: The information presented does not constitute financial, investment, trading, or other types of advice and is solely the writer’s opinion.
- The market structure was bearish on the 4-hour chart and strongly hinted at further losses.
- An imbalance above Ethereum prices meant a small bounce could arrive soon.
Ethereum prices saw a rejection at the $1715 level and the trend has been bearish since then. However, the asset has traded within a range since mid-January. Could ETH descend to $1500 from here?
How much are 1, 10, and 100 Ethereum worth today?
A recent report highlighted that Ethereum exchange supplies had fallen, which suggested selling pressure might not spike. On the other hand, the price action showed that the lower timeframe was bearish. How much lower will the prices go?
The $1600 area could be retested before another move down
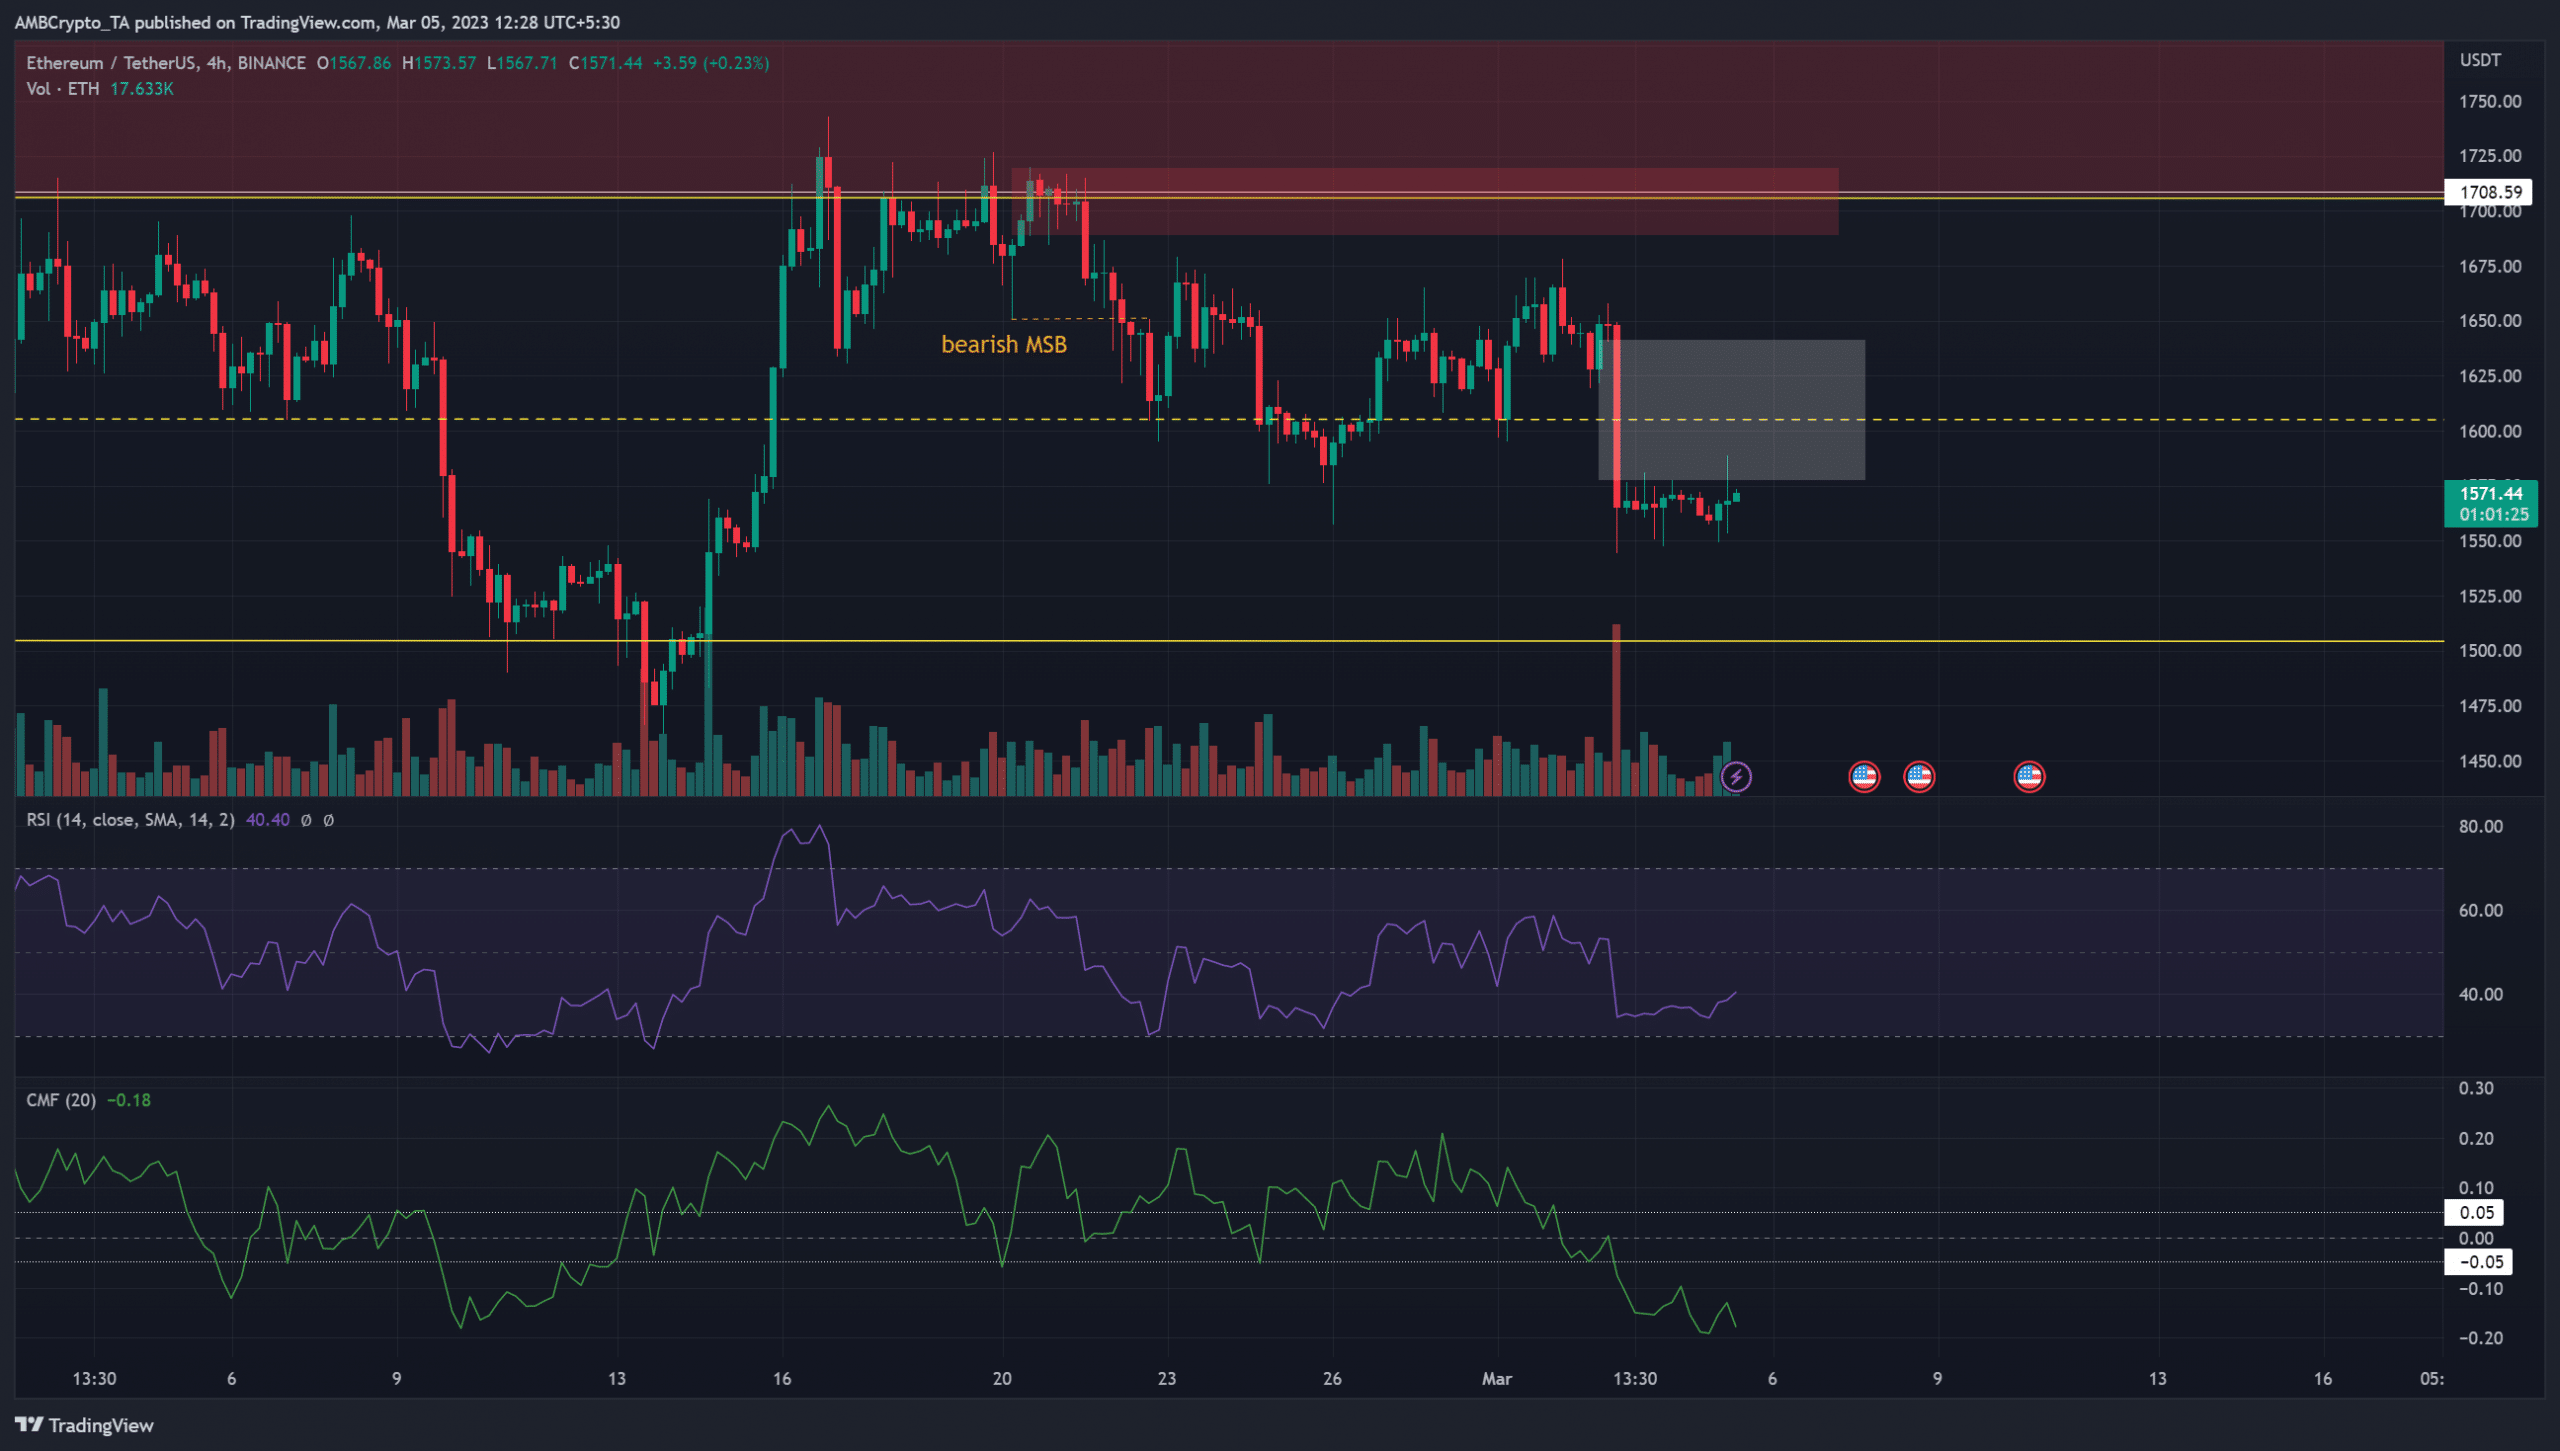
The aforementioned range was highlighted in yellow. It extended from $1505 to $1708, with the mid-range at $1606. All three levels have been significant in the past six weeks. In particular, the mid-range was respected multiple times, which underlined the credibility of the range.
On 22 February the market structure flipped to bearish and was marked in orange. Since then, the price continued to make a series of lower highs and lower lows.
The RSI was also beneath neutral 50 to show bearish momentum at press time. The CMF stood well below -0.05 to show heavy capital flow out of the market.
Is your portfolio green? Check the Ethereum Profit Calculator
After the sharp fall in prices on Friday, the market has moved sideways. An important thing to note was the large imbalance left on the charts, highlighted in white. It was likely that this fair value gap will get filled partially or completely in the coming days.
This imbalance has confluence with the mid-range mark as well. Therefore short sellers can wait for a retest of $1600-$1610 before looking for selling opportunities.
Flat Open Interest showed sidelined market participants
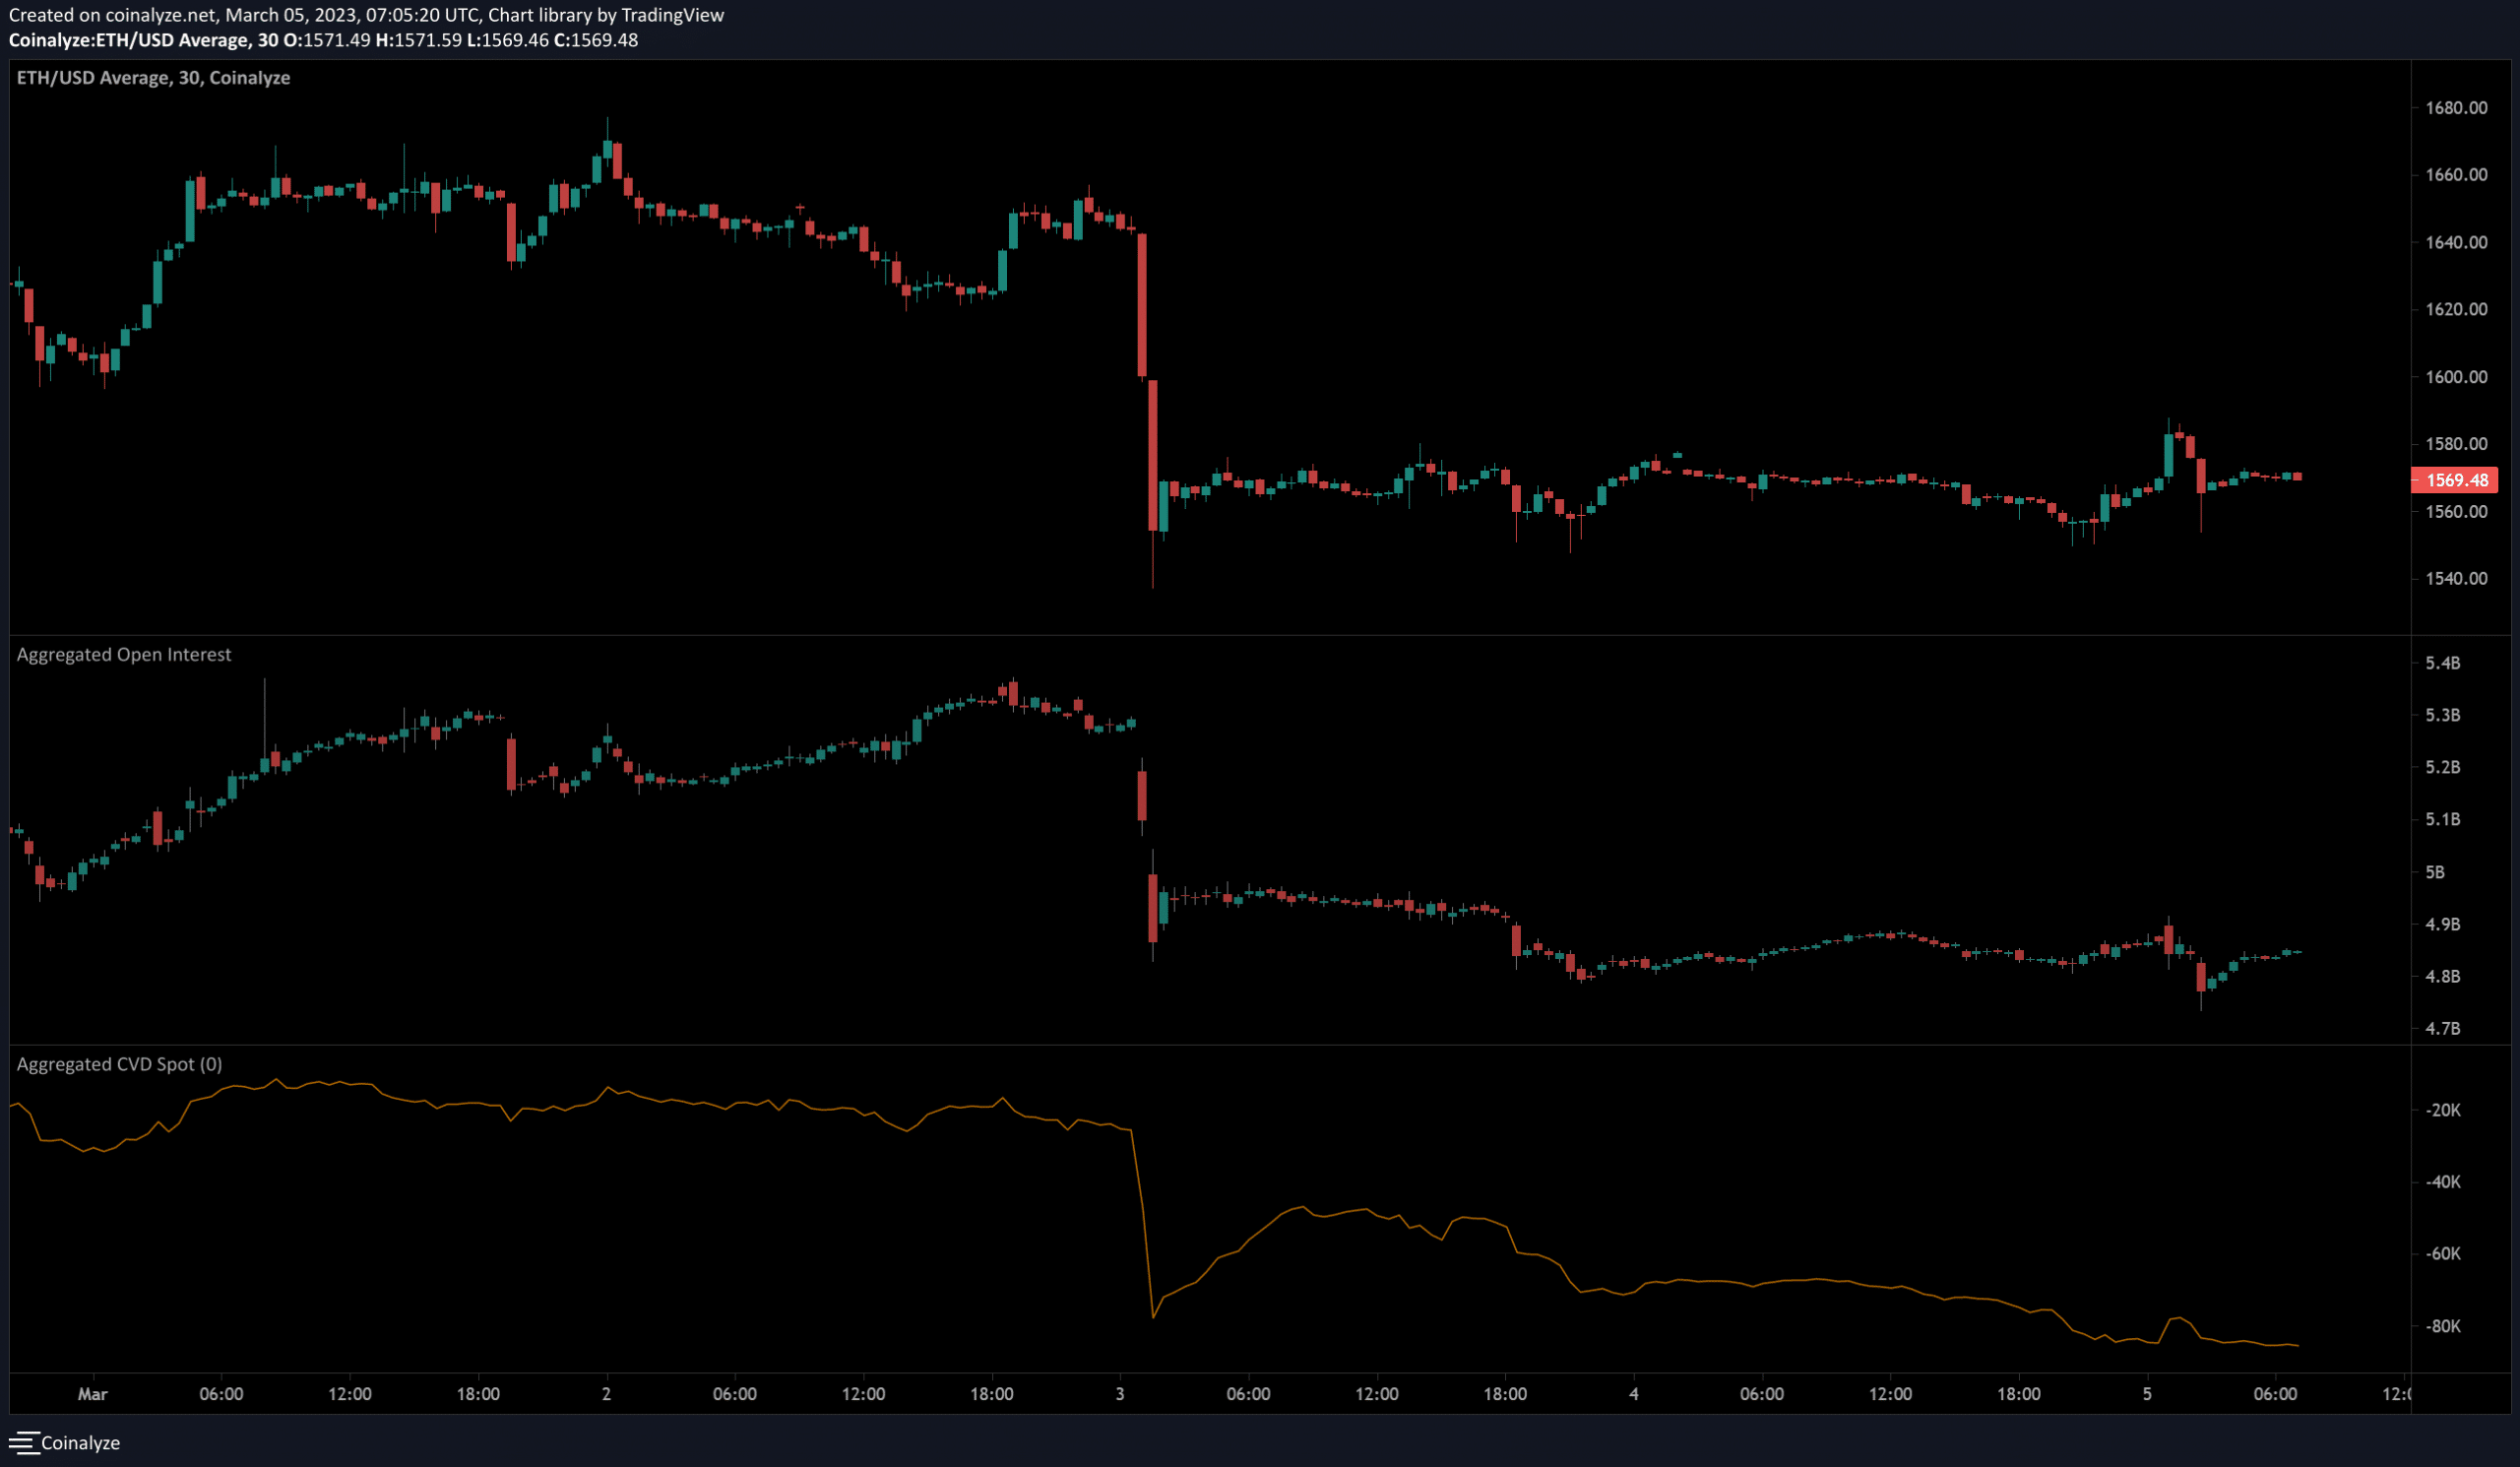
After the fall on 3 March, the Open Interest did not budge by a large margin. The small move up from $1550 to $1588 was accompanied by a commensurate rise in the Open Interest.
The lack of volatility meant OI did not rise and fall sharply, which suggested many ETH futures traders remained sidelined.
Meanwhile, the spot CVD continued to sink lower and lower. This indicated strong, persistent selling pressure in the past three days, and supported the notion that Ethereum would sink to $1500 soon.


