Ethereum’s correlation with S&P500 could mean this for your portfolio

In the past few years, the cryptocurrency market has shared a close correlation with the stock market. For instance, in February, it was reported that the leading alt, Ethereum [ETH], started to move more closely with U.S. stocks.
According to the report, a 40-day correlation coefficient for the token and the S&P 500 marked a spot of 0.65, reaching an all-time high. In the face of growing uncertainties that face the global economy, Santiment, in a new report, found that the price of ETH continues to follow “tightly with the S&P500.”
According to Santiment, the S&P 500 retested the break zone during the intraday trading session on 25 August.
This break-out zone had previously formed resistance to this category of assets. Therefore, the break zone has to be converted into support for a bullish continuation.
With the ETH following very closely with the S&P 500, Santiment noted,
“It’s important that the retest levels see a bounce for bullish continuation else, it’s highly unlikely that ETH will hold its ground.”
ETH on the chain
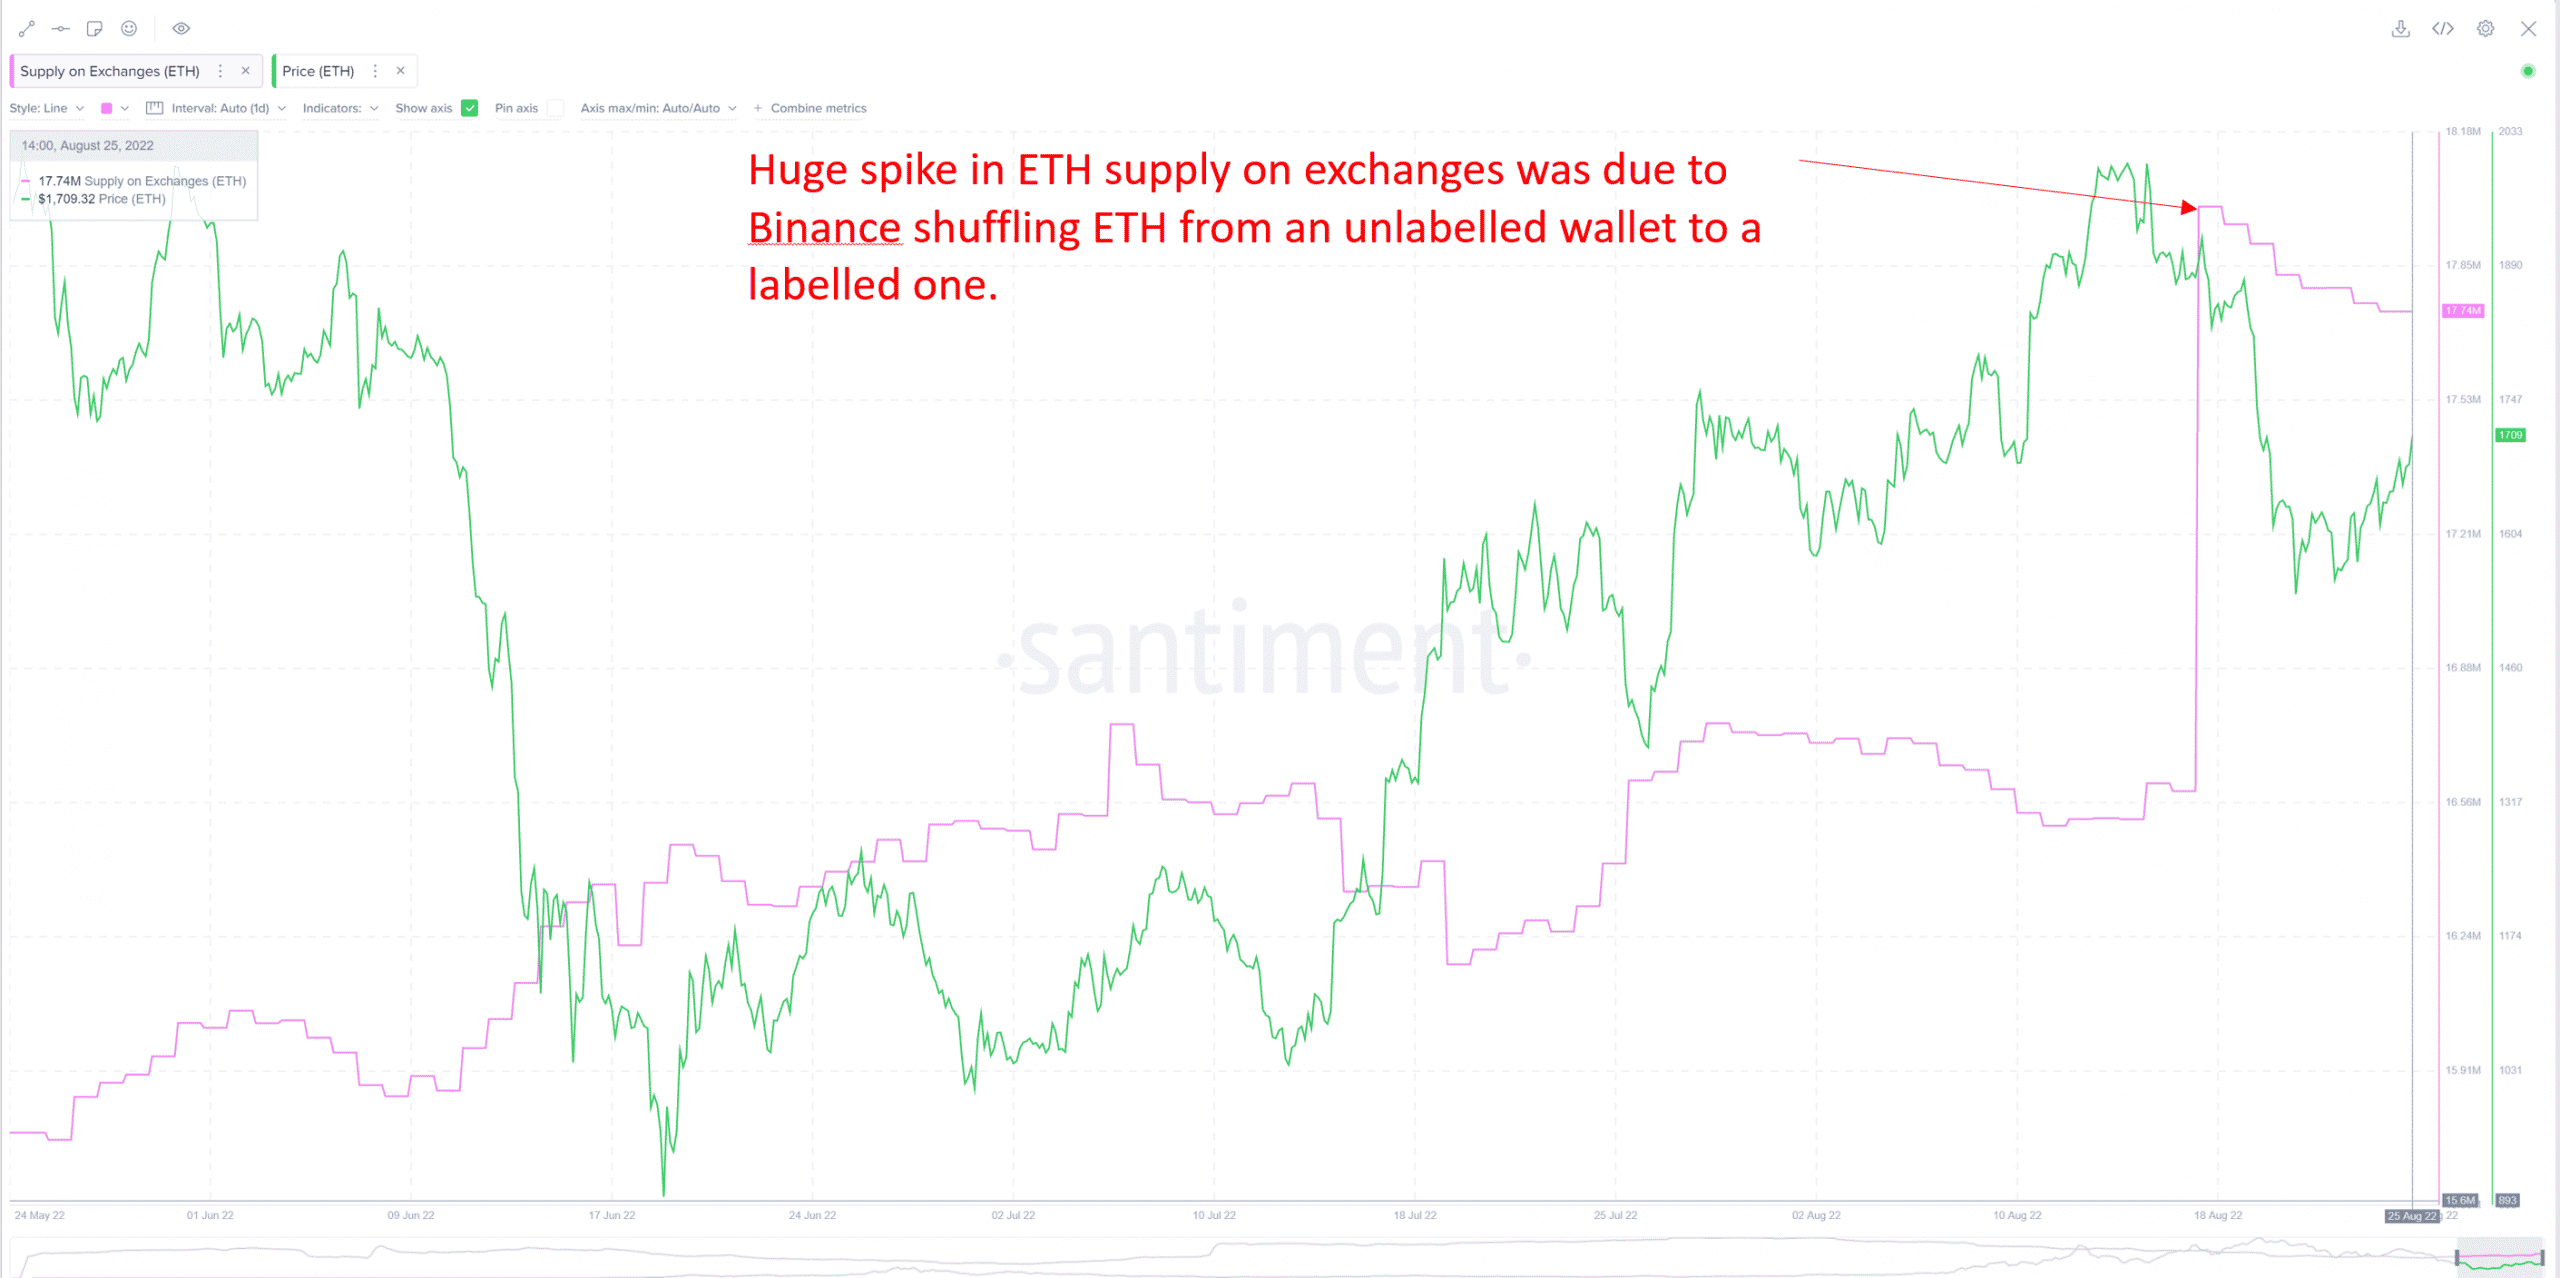
According to data from Santiment, on 18 August, ETH saw a significant spike in its supply on exchanges. However, the price of the leading alt soon fell from the $1,800 region.
According to data from Etherscan, this uptick in the supply of ETH on exchanges on that day resulted in Binance moving 1.49 million ETH from an unknown wallet to the Binance 8 wallet.
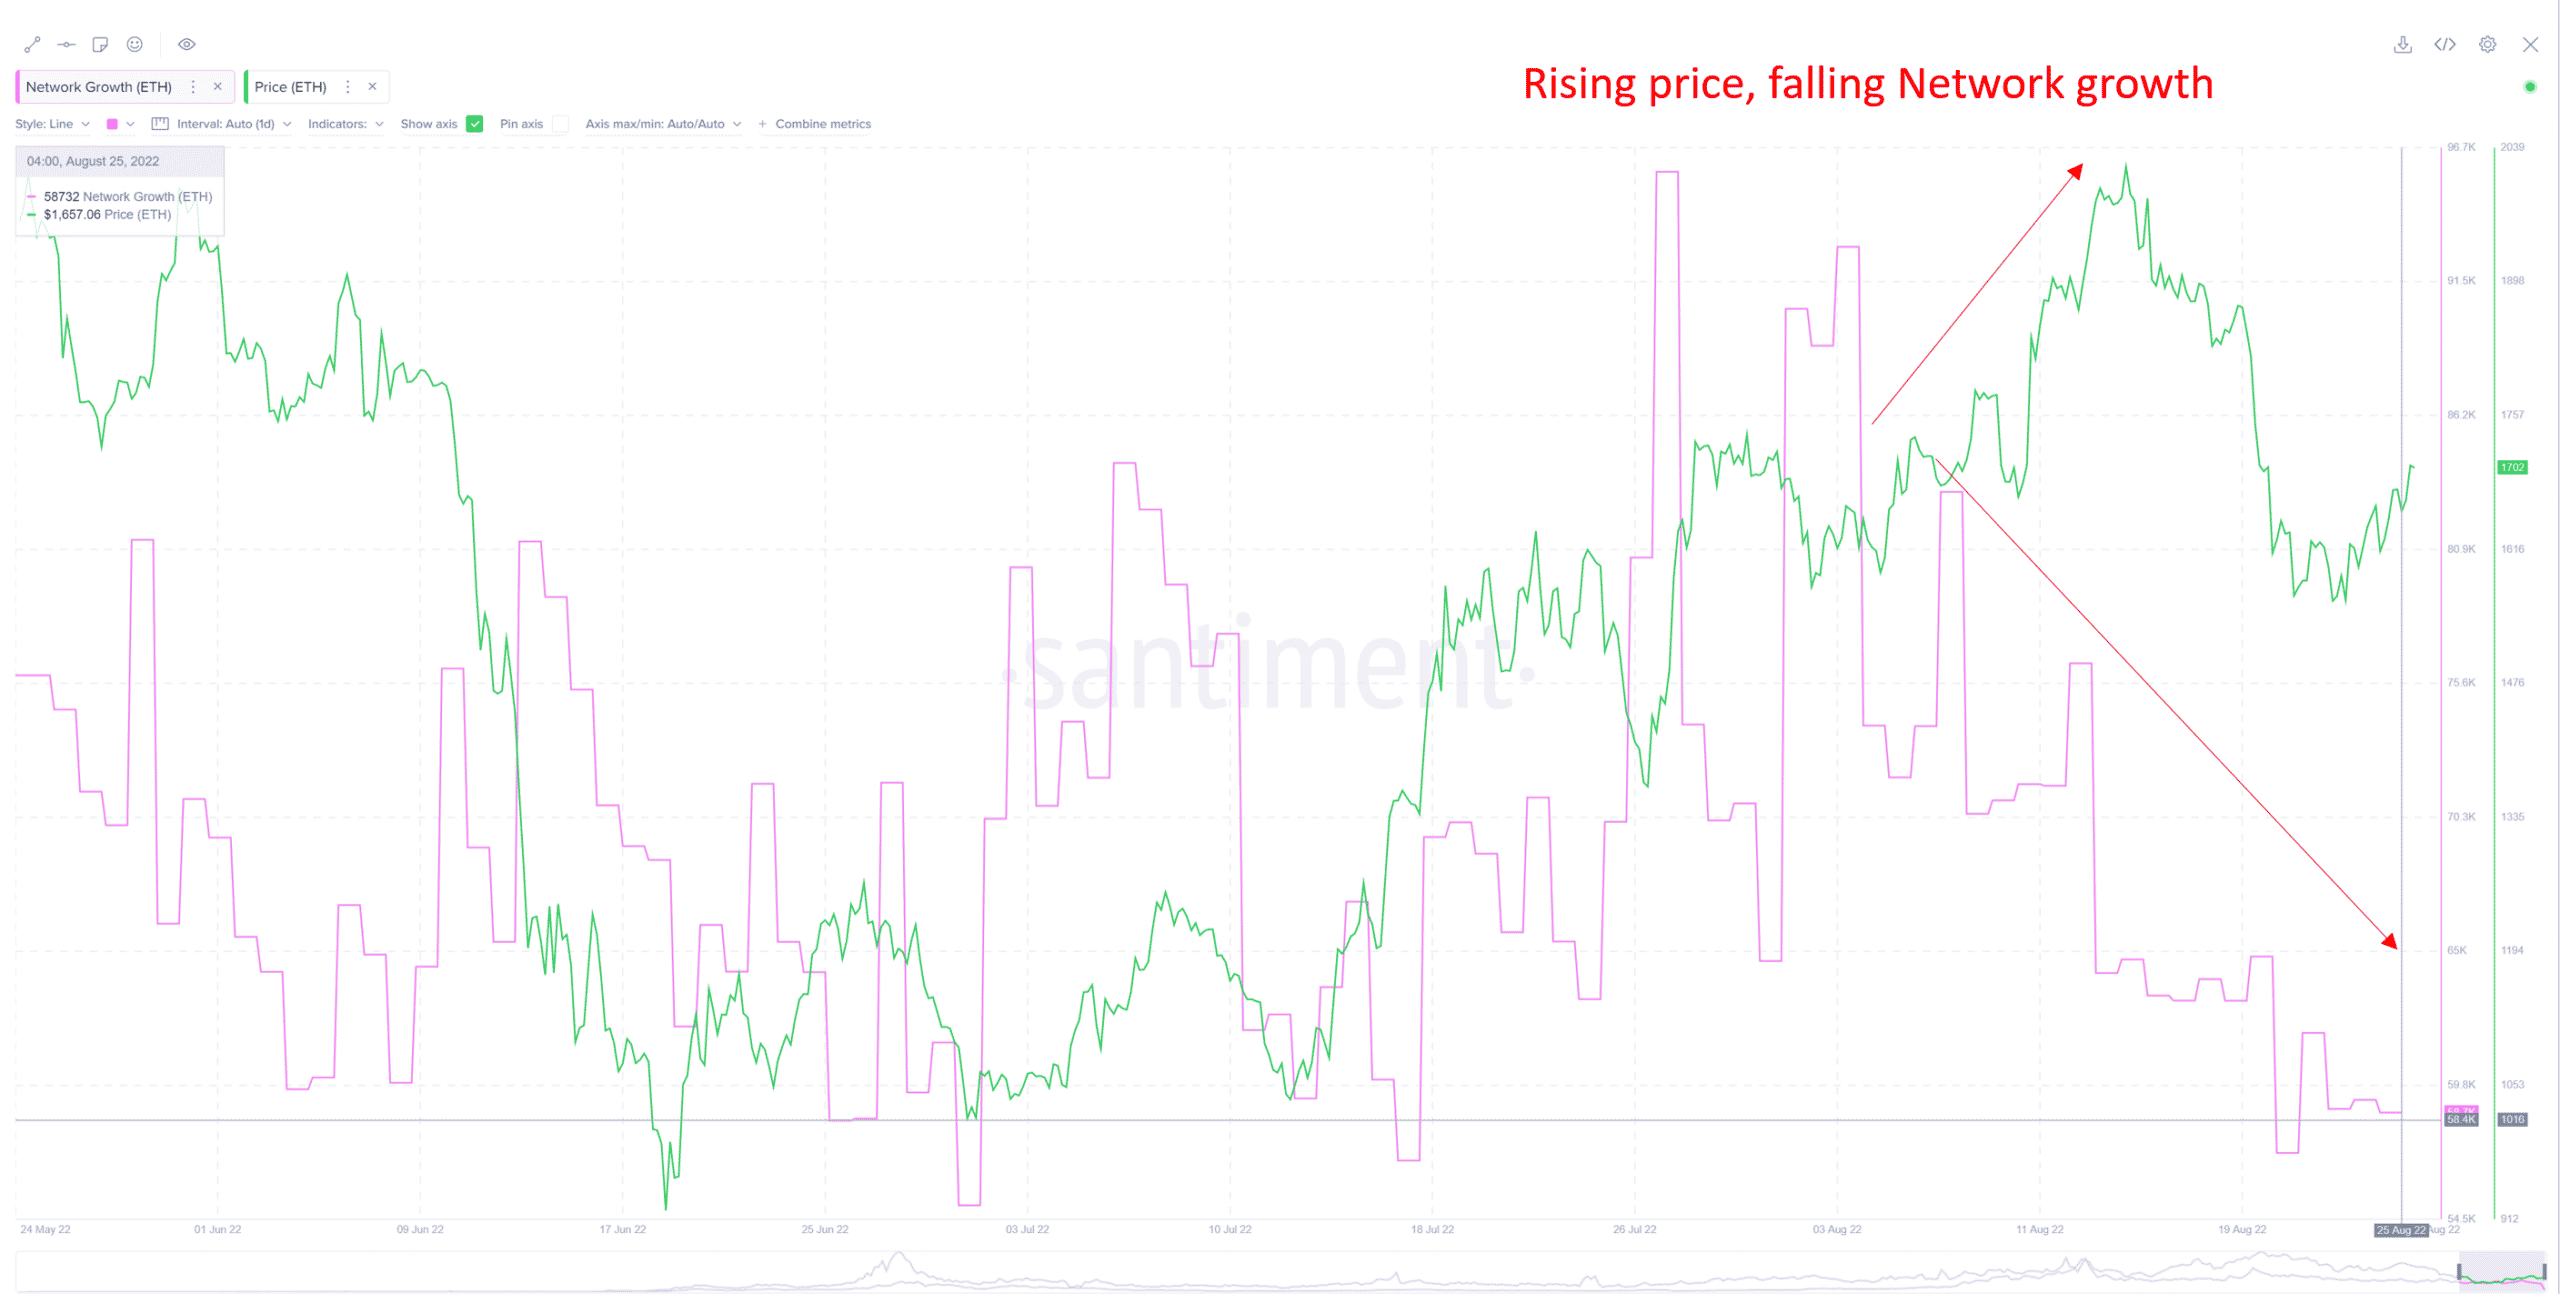
Furthermore, the month so far has been marked by a divergence in the price of ETH and its network growth. Since the beginning of August, data from Santiment showed that new addresses joining the ETH network had declined. However, the price of the alt continued to witness a steady climb.
This divergence indicates a generally weak market. It also suggests that there are very few “new market participants coming in to support the price,” Santiment found.
Santiment also found that the MVRV for seven days revealed that the market was in a neutral zone after exiting the opportunity zone.
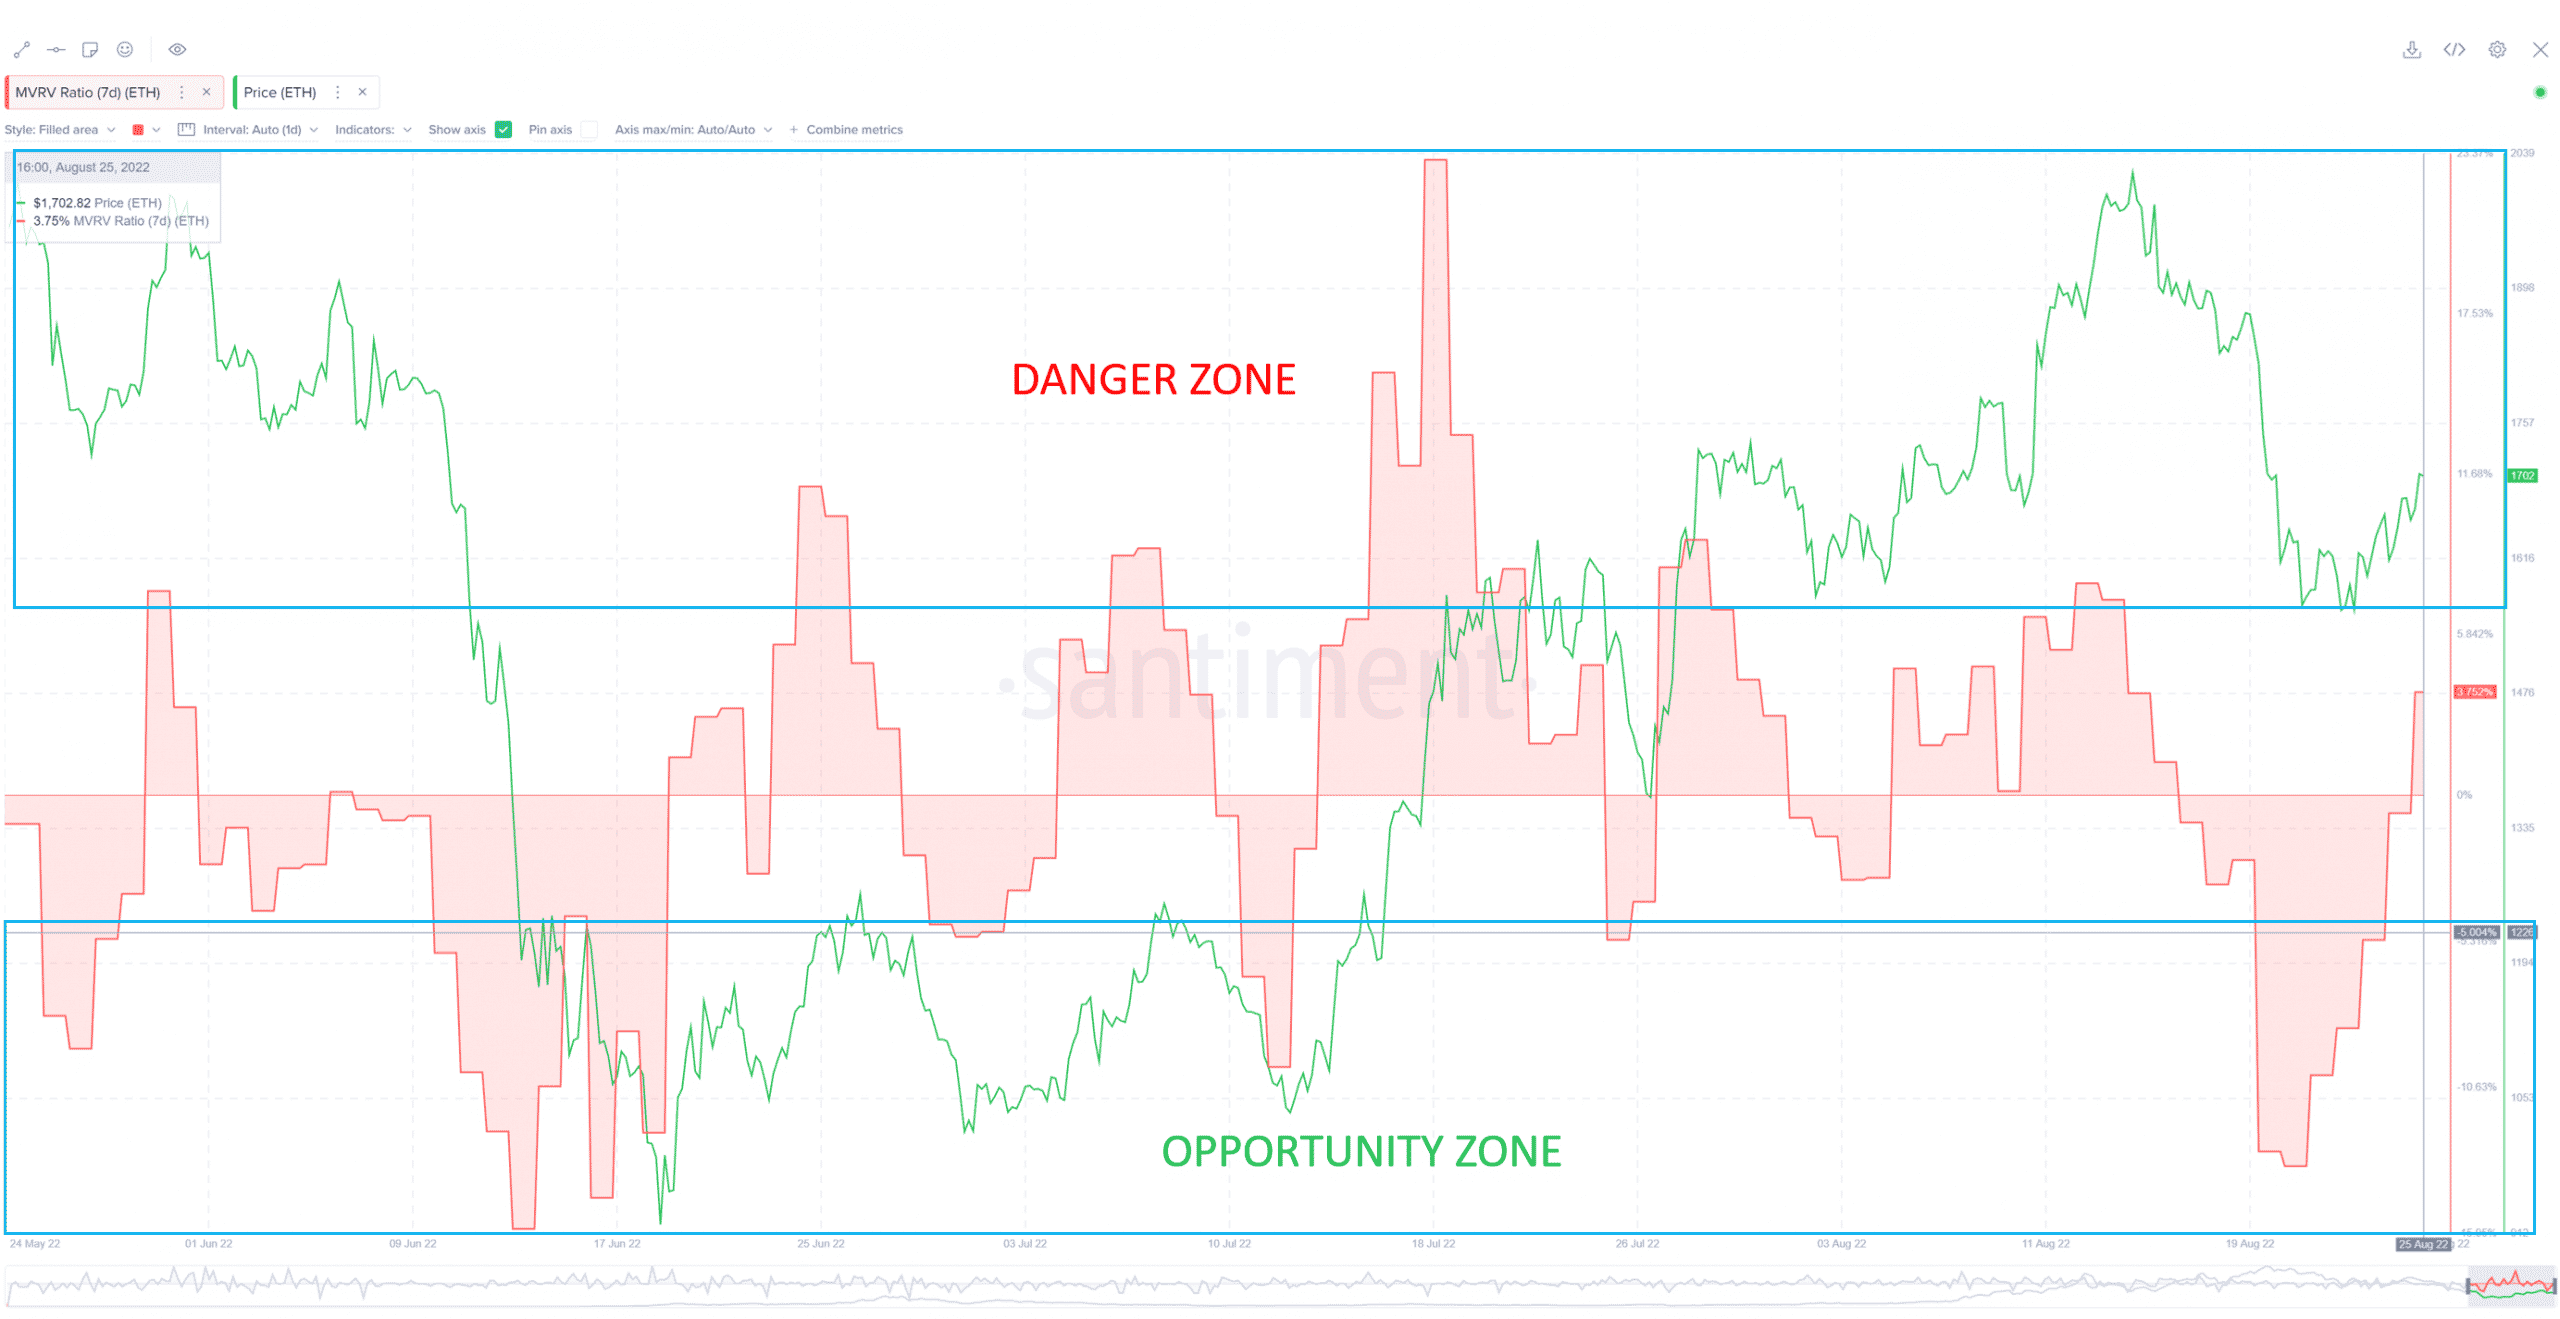
As for the MVRV 30, the metric posted a negative value of -5.925% as of this writing.