Ethereum’s [ETH] latest breakout and what it means for you

Disclaimer: The findings of the following analysis are the sole opinions of the writer and should not be considered investment advice
Over the past week, Ethereum [ETH] has flipped the $1,603-level from resistance to support after a morning star candlestick setup. Post jumping above its three-month trendline support (white, dashed), the bulls found renewed buying pressure and reclaimed their spot above the 20/50 EMA.
The supply zone (green, rectangle) could propel a near-term slowdown as the price action approaches the apex region of its reversal pattern.
A potential rebound from the upper band of the Bollinger Bands (BB) could position the alt for a near-term slowdown. At press time, the alt was trading at $1,713.5, up by 1.83% in the last 24 hours.
ETH Daily Chart
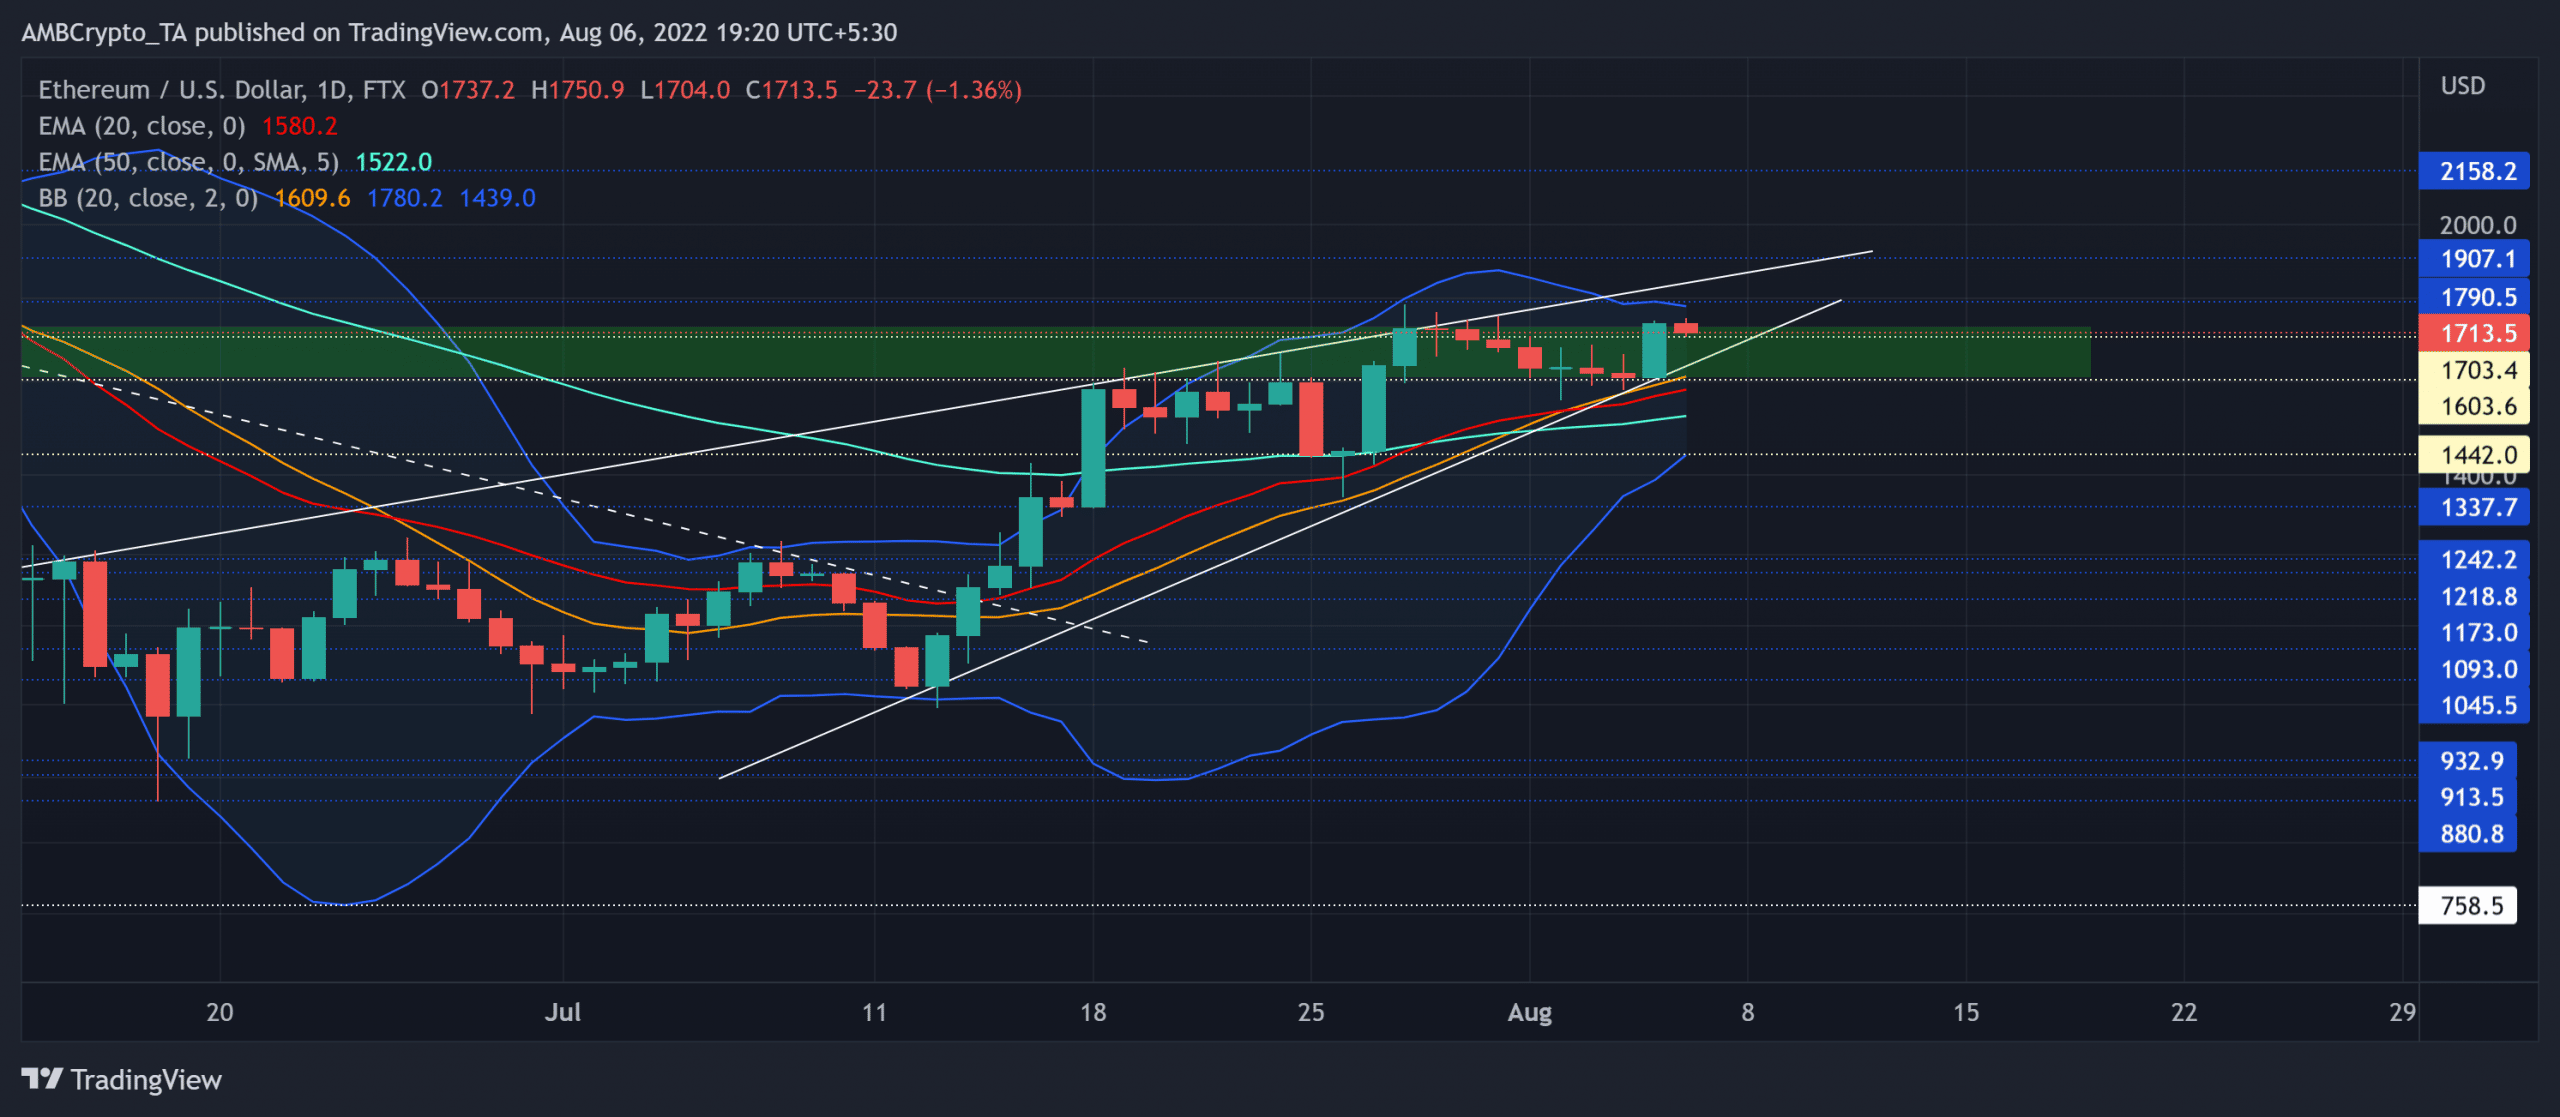
ETH’s long-term trendline resistance (now support) finally cracked after a market-wide buying resurgence. Meanwhile, the basis line of the BB looked north and underlined a buying edge.
The altcoin saw an over 73% ROI from its 13 July low and slammed its immediate supply zone around the $1,750-region, at the time of writing. Nevertheless, the recent bullish engulfing candlestick could propel near-term buying tendencies. The bullish crossover on the 20/50 EMA has further reaffirmed the buying edge on the daily timeframe. Any close above the $1,790-mark would hint at a bearish invalidation. In this case, the potential target would lie around the $1,900-region.
Should the buyers succumb to the rising-wedge structure, ETH could see a close below the basis line of BB. In such a case, the $1,442-level could cushion immediate retracements.
Rationale

The Relative Strength Index held its position above the midline to reflect a buying advantage. Traders/investors should watch for a revival towards or below the 57-level support to identify prospects of a bullish invalidation.
Although the price action has maintained its peaks over the last week, the Volume Oscillator plunged to reflect a bearish divergence. Unless buyers further amplify buying volumes, the bears could hold on to the supply zone.
Conclusion
In light of the rising wedge setup approaching the supply zone, ETH could see sluggish behavior in the coming sessions. However, a close beyond the $1,790-level would affirm a bearish invalidation. The potential buying/selling targets would remain the same as discussed above.
Finally, investors/traders need to watch out for Bitcoin’s movement. This, because ETH shares a staggering 94% 30-day correlation with the king coin.