Ethereum’s exchange deposit surge: Uncovering trends, outflows, and price upticks
According to a tweet by Glassnode Alerts, there has been a significant upswing in ETH deposits.

- Exchange deposits of Ethereum have spiked to a nine-month high
- ETH saw a slight uptrend in price but was still stuck in a bear trend
Ethereum has seen a notable surge in exchange deposits, marking a level of activity not seen in months. However, amidst this surge, which exchange flow has consistently maintained the highest flow in recent days?
Read Ethereum (ETH) Price prediction 2023-24
Ethereum deposits spike
According to a tweet by Glassnode Alerts, there has been a significant upswing in ETH deposits. In fact, at the time of writing writing, exchange deposits had exceeded 161,000, marking the highest level observed in over nine months.
Prior to this, the highest deposit level recorded on the chart was approximately 98,000, and this was in January.
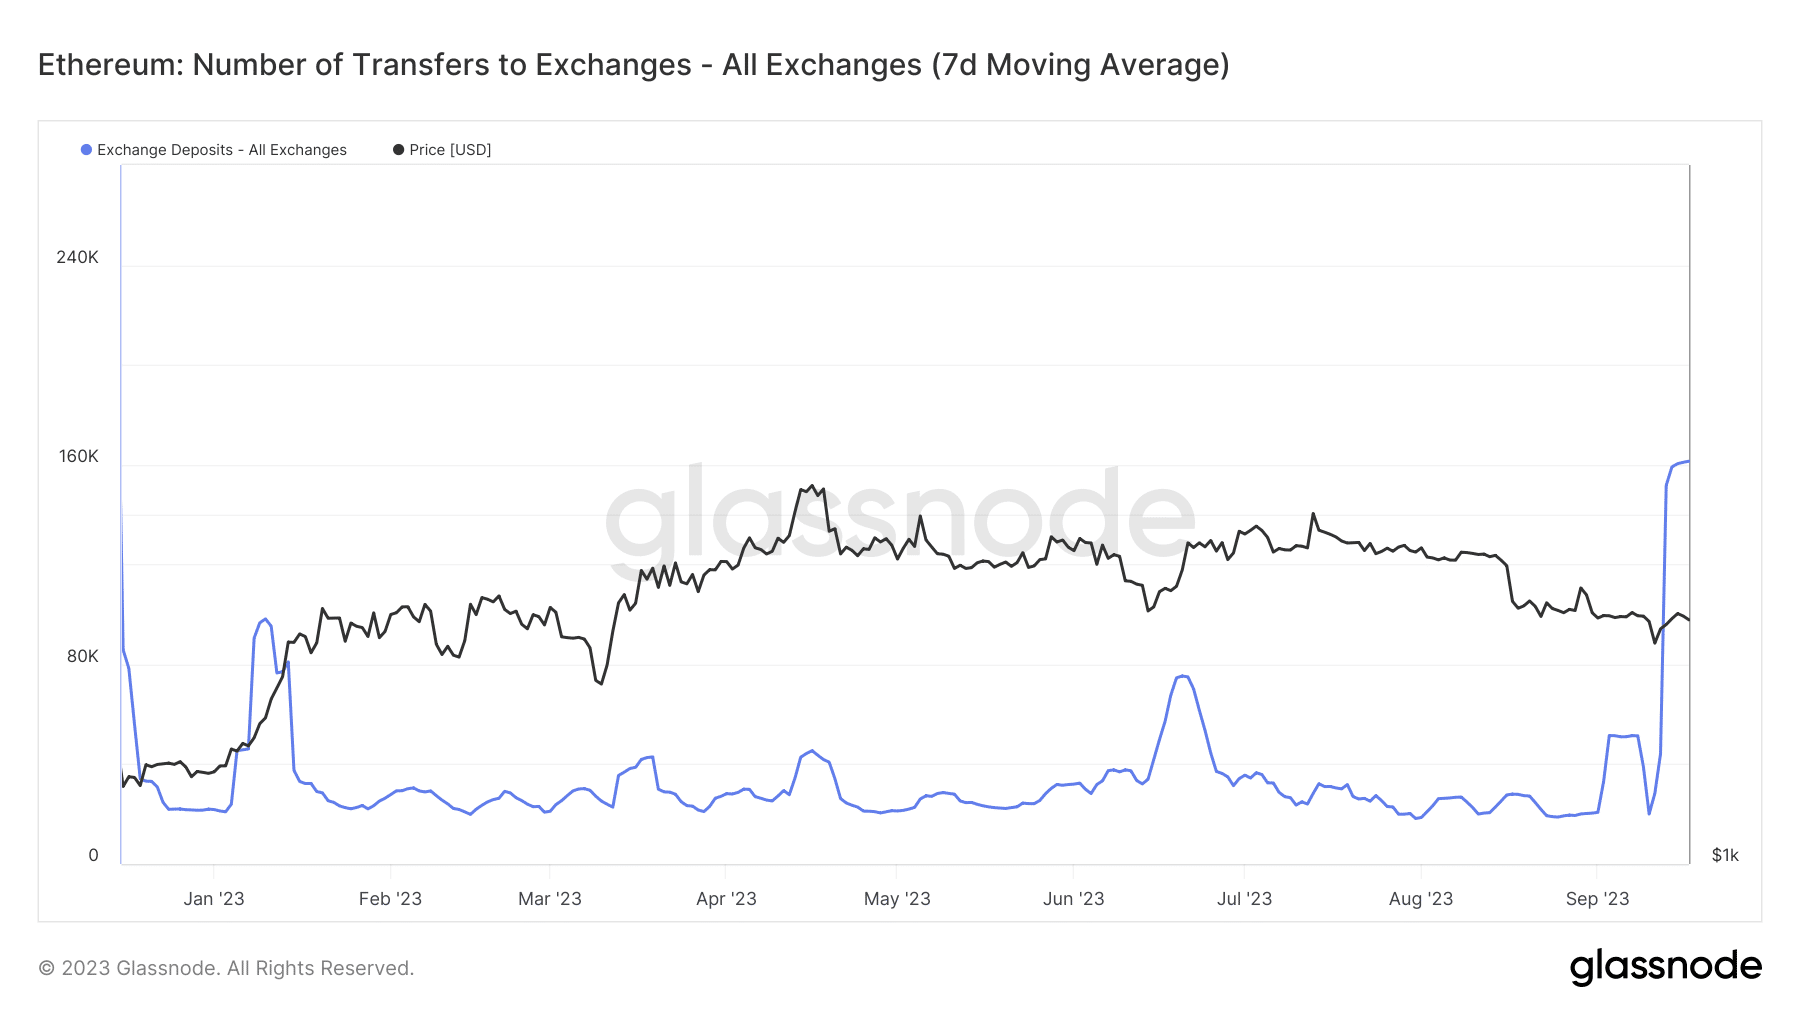
To provide some context to the same, it is worth noting that Ethereum typically witnessed an average exchange deposit of around 30,000, excluding occasional spikes. This context emphasizes the significance of the recent spike and prompts questions about its impact on the flow of Ethereum.
Analyzing the Ethereum exchange flow
Despite the notable increase in exchange deposits, as illustrated by Glassnode’s chart, it appears that more Ethereum has been exiting exchanges. According to the Netflow chart provided by CryptoQuant, over the past few days, Ethereum outflows have been surpassing inflows.
This is a sign that even though significant volumes of ETH were being deposited into exchanges, an even greater amount was being withdrawn.

The netflow chart revealed that the last instance of inflows surpassing outflows happened around 15 September. At press time, however, the netflow is -18,223. Here’s the caveat though – The netflow direction may change by the end of the day, but the dominance of outflows remains apparent.
Spike in volume?
Examining the volume metric via Santiment also revealed fluctuations in Ethereum’s recent trading activity. The chart indicated that Ethereum’s trading volume recorded a decline, dropping to approximately $2.7 billion on 17 September from over $4 billion the day before.
However, at the time of writing, the volume had rebounded to surpass $3 billion, signalling a slight hike on the chart.
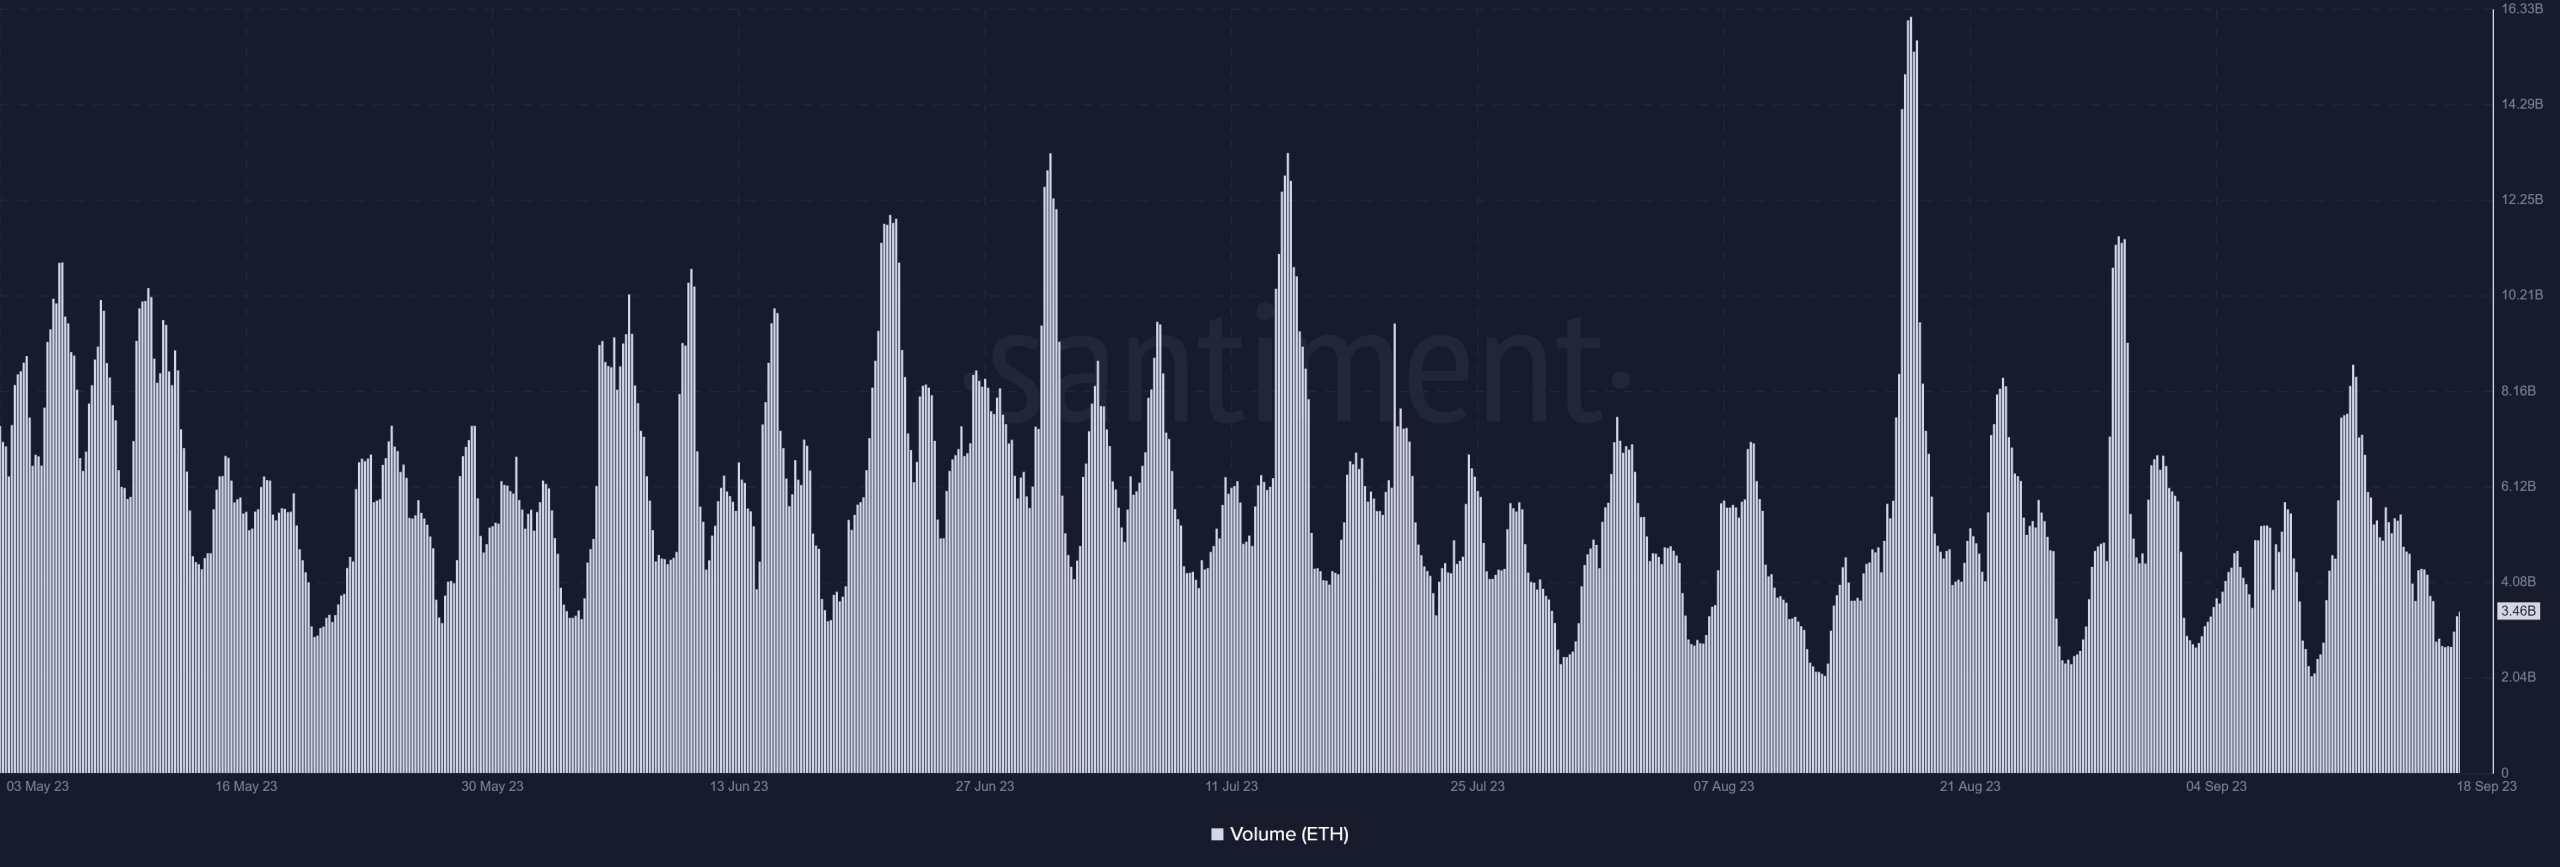
It remains uncertain whether the surge in exchange deposits played a role in this volume uptick, but it’s certainly a plausible factor to consider.
– How much are 1,10,100 ETHs worth today
ETH’s uptrend not strong enough
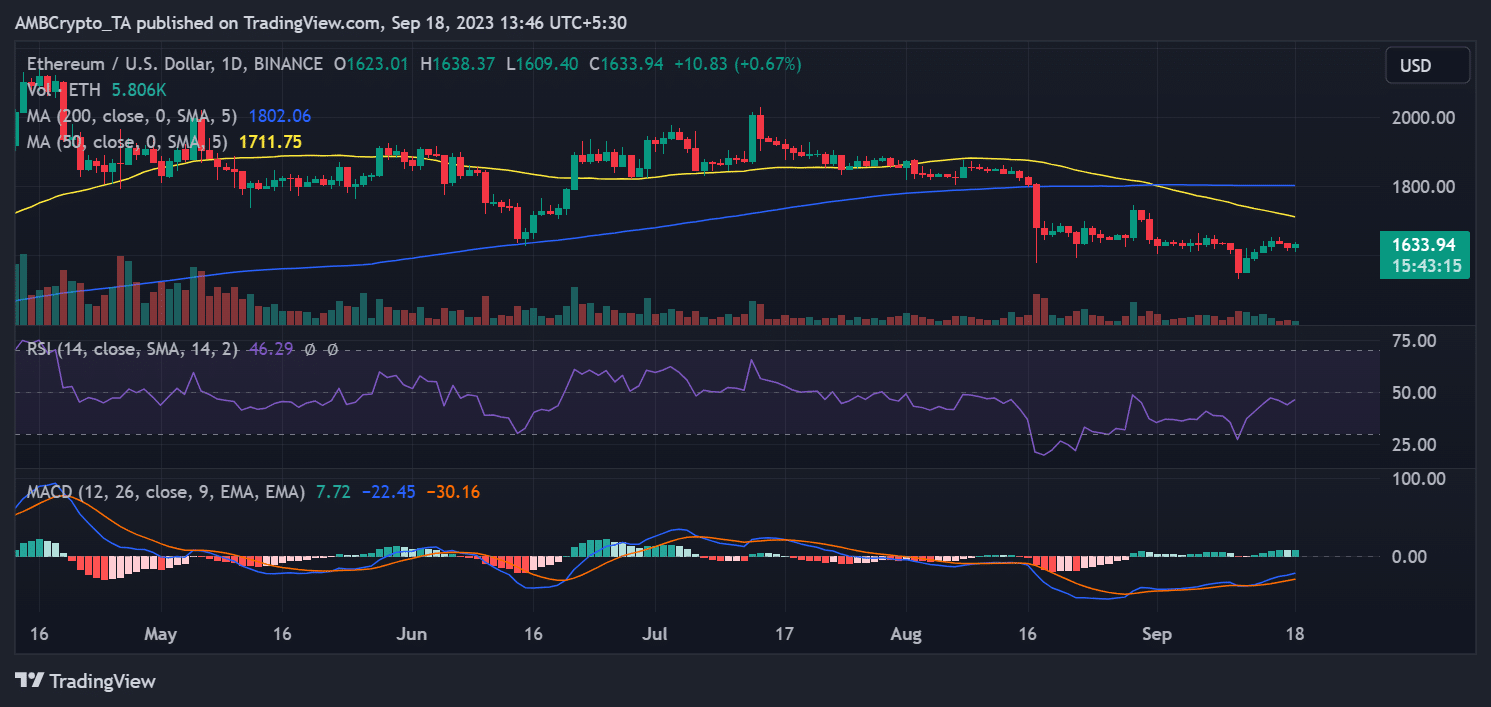
Following two consecutive days of a slight price decline, Ethereum has appreciated on its daily price chart. At press time, it was trading at approximately $1,633, reflecting a modest hike of less than 1%.
Notably, the short-term Moving Average (yellow line) continued to act as resistance, particularly around the $1,700-price level. Additionally, Ethereum’s Relative Strength Index (RSI) remained below the neutral line, indicative of its ongoing bearish trend.