
After being in a consistent uptrend, Ethereum recently registered a downtrend along with several other cryptocurrencies.
After hitting the lowest mark of $911 in mid-June, ETH gained strong upward momentum and even crossed $2,000. This gave hope to investors of brighter days ahead.
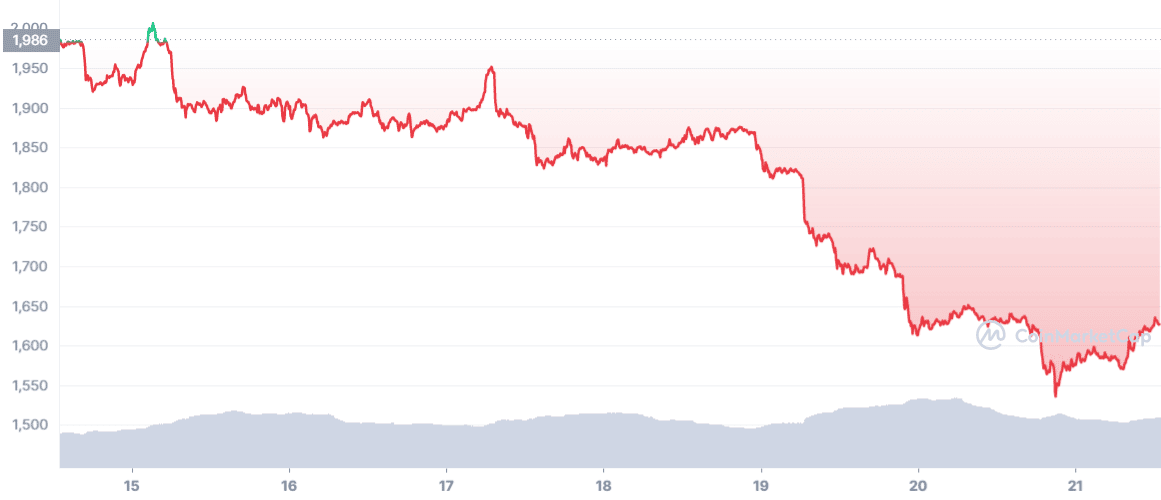
Source: CoinMarketCap
However, things took a U-turn on 14 August as a trend reversal kicked in. With a negative 19% 7-day growth, the king of altcoins traded at $16,180 with a market capitalization of $197,496,029,109 at the time of writing.
Interestingly, the plunge in price did not affect the coin’s several essential on-chain metrics.
Consider this- ETH’s number of non-zero addresses reached an all-time high of 85,252,481. With increased trust in Ethereum a few weeks ahead of the much-awaited Merge, can we expect a bull rally?
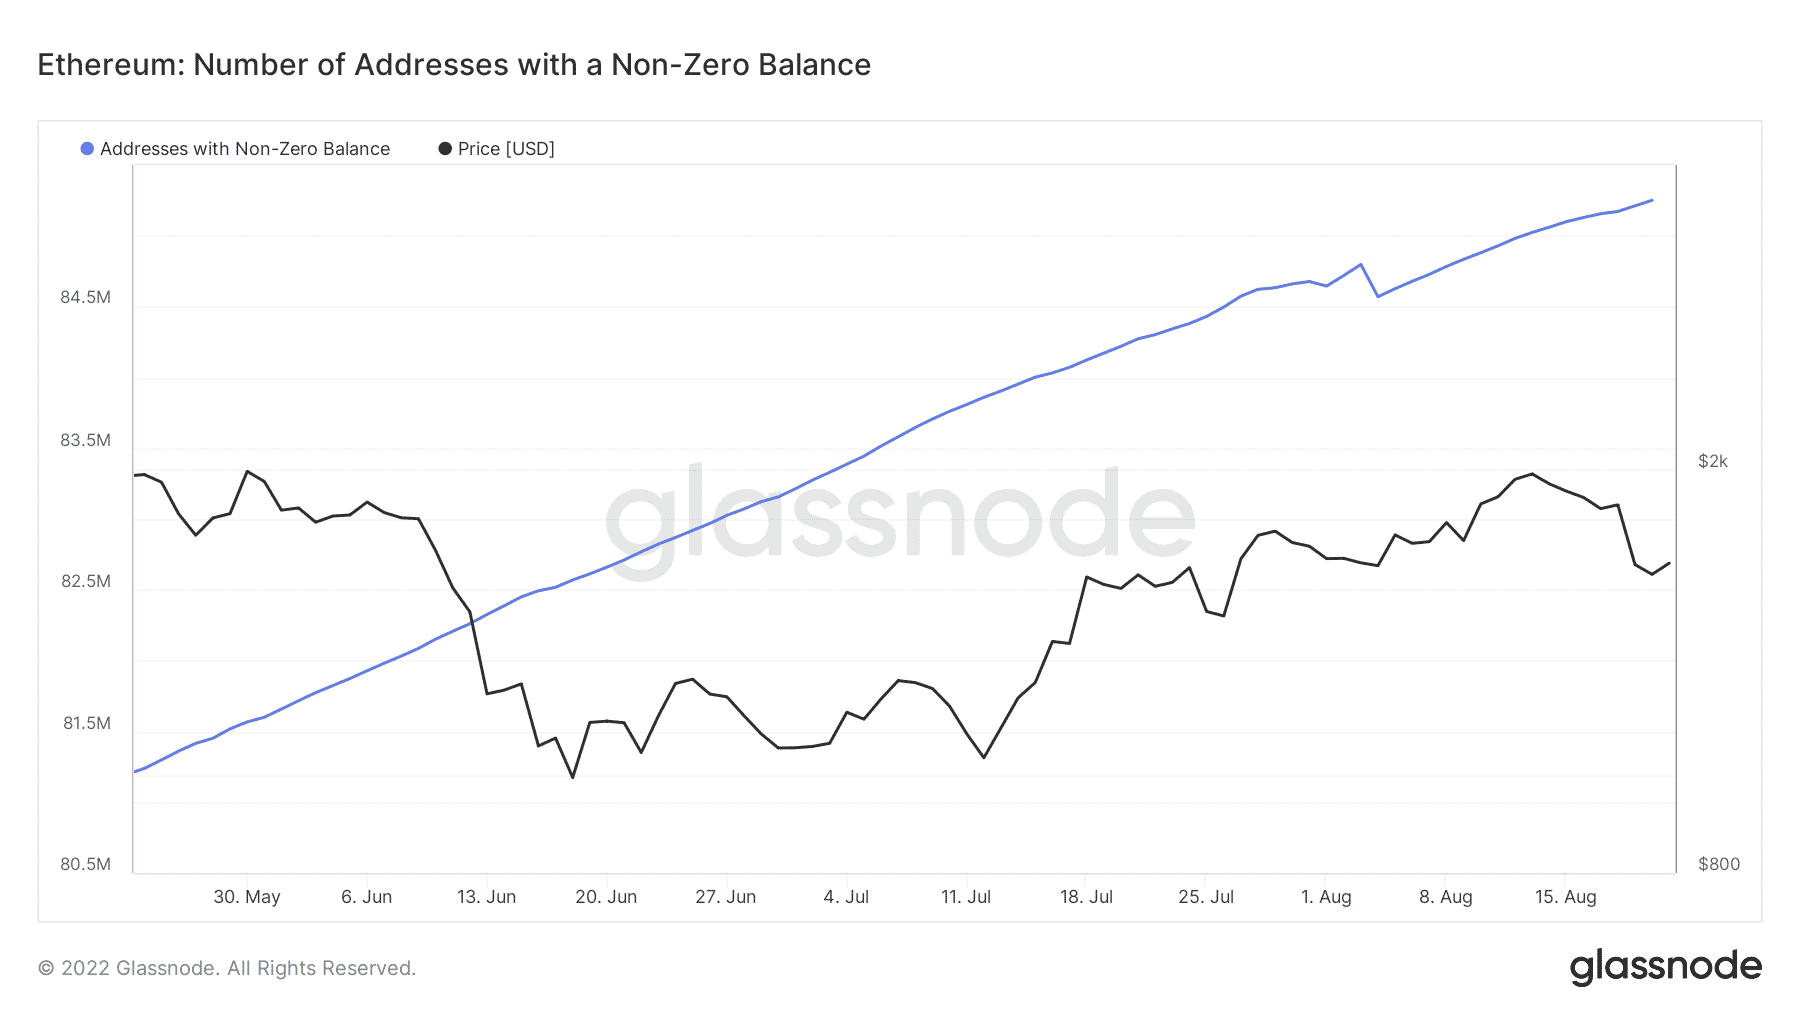
Source: Glassnode
Exploring the answer through metrics
As we approach the day of the ETH Merge, not only did the number of accounts with non-zero balances increase, but the supply held by top addresses also increased despite the plunge in the coin’s price.
After registering this month’s low on 14 August, the number increased while Ethereum’s price fell.
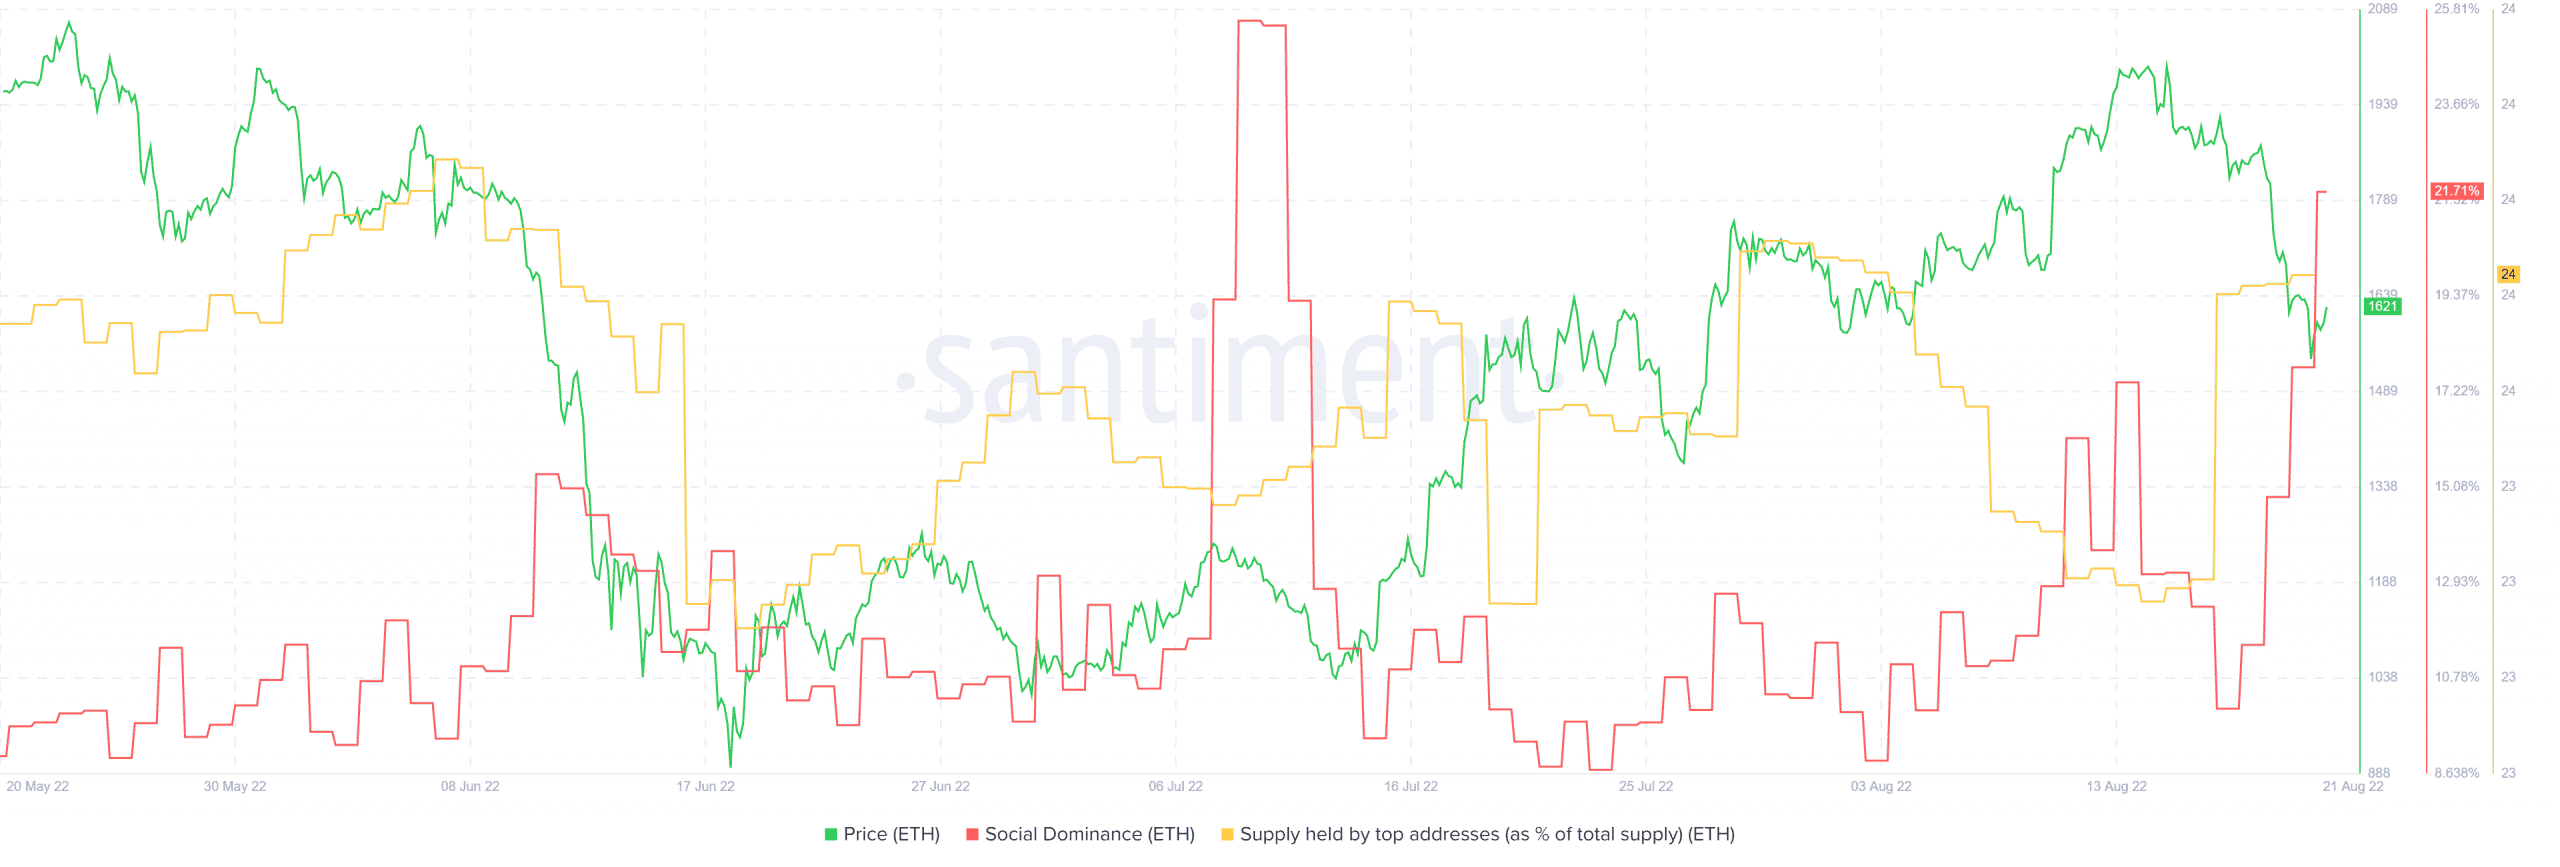
Source: Santiment
Evidently, HODLers have been expecting a price boost post Merge.
Here, it should be noted that the total exchange inflow volume decreased recently, which can be taken as a bullish signal.
Moreover, ETH’s social dominance also skyrocketed to nearly 21%. Thus, suggesting an increased interest from the community.
Looking Forward
A look at Ethereum’s 4-hour chart, at press time, suggested a bearish upper hand in the market.
After a massive bull advantage, the Exponential Moving Average (EMA) ribbon indicated a trend reversal.
At the time of writing, the 55-day EMA was considerably above the 20-day EMA.
Undoubtedly, ETH’s price, at press time, was in a high volatility zone as indicated by the Bollinger Band (BB). This hinted at a price crunch that could soon be expected.
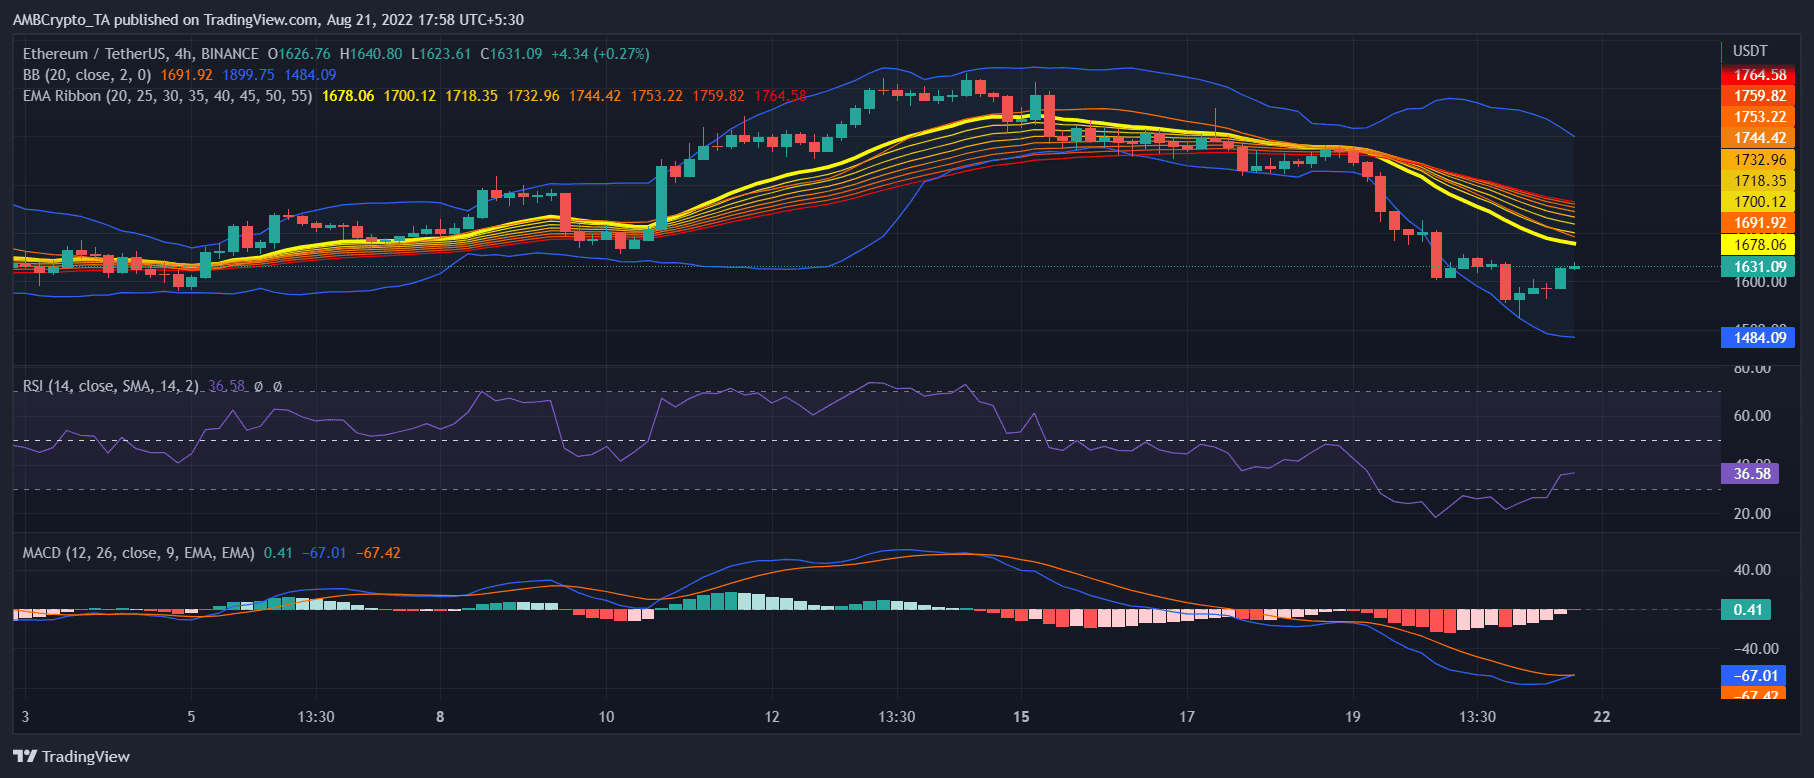
Source: TradingView
However, the leading indicator MACD showed a different picture, as the blue line was on the verge of flipping the red line, which points towards a bullish momentum.
RSI’s data complemented the data of MACD as it showed that Ethereum rebounded from the oversold zone, reducing the chances of a further plunge.
Therefore, coupling the metrics and market indicators, a slight possibility arises of Ethereum gaining northbound momentum in the coming days.