Fantom appears to form a range, here’s what traders can watch out for

Disclaimer: The information presented does not constitute financial, investment, trading, or other types of advice and is solely the writer’s opinion.
- The market structure was bullish on higher timeframes.
- The establishment of a range could offer a period of consolidation.
In January, Fantom rallied from $0.16 and reached $0.65 in early February. It represented a 230% move upward, and at the time of writing FTM traded near the zone of support at $0.43.
It appeared unlikely that such a strong move could occur over the next month or two.
Read Fantom’s [FTM] Price Prediction 2023-24
The markets generally need time to consolidate before such a move, upward or downward. Fantom was inside one such phase of consolidation. The asset showed signs of forming a range, which traders can use in the coming weeks.
The formation of a range meant traders can look to bid FTM at the lows
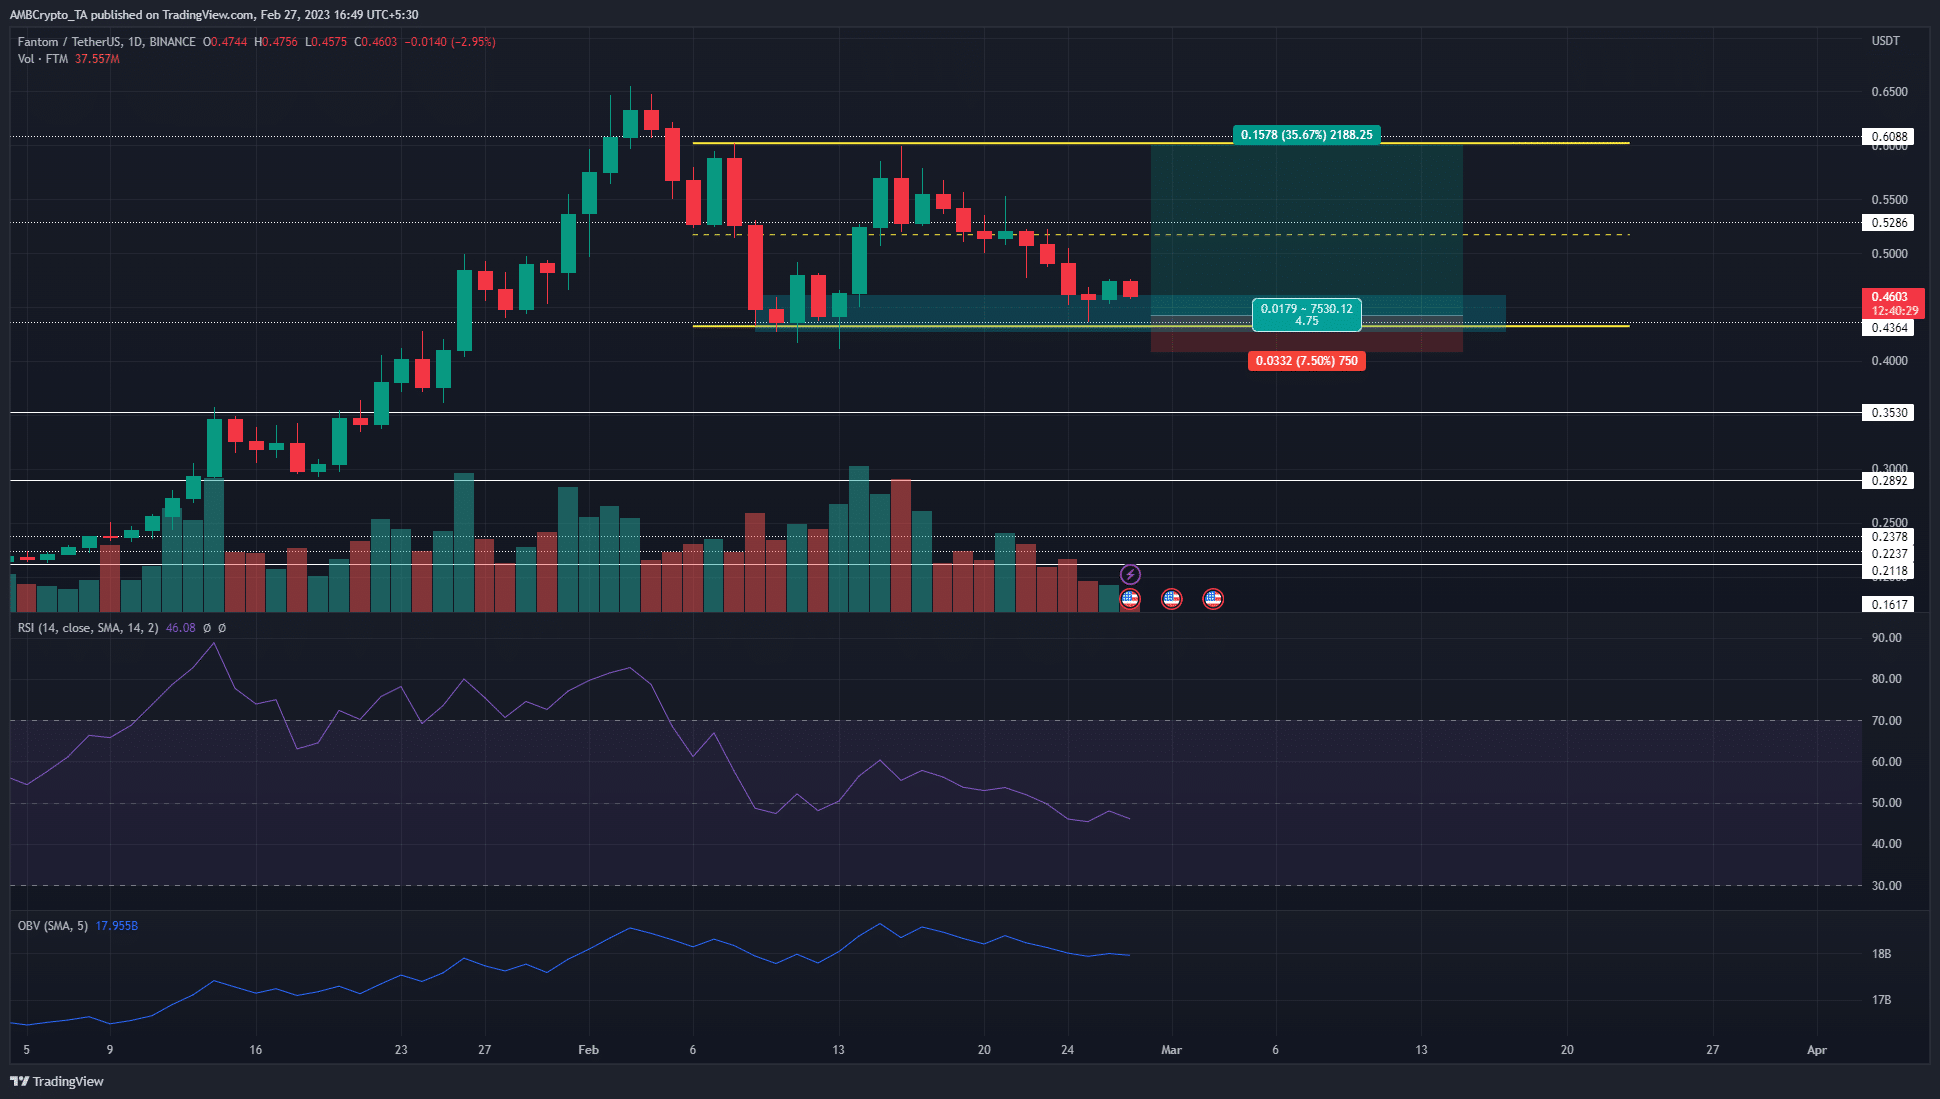
The range extended from $0.43 to $0.6, with the mid-point at $0.515. This range was less than a month old. Moreover, the extremes of the range have only been tested twice each. The fact that the mid-range mark was respected as both support and resistance suggested that the range plotted in the chart above was viable.
A bullish order block was spotted at the bottom of a range. From this level, FTM saw a violent move northward to reach $0.6 in mid-February. At the time of writing, the price was testing the same region once again.
The RSI slipped beneath the neutral 50 mark, to highlight some bearish momentum. It underlined the possibility that a downtrend might commence. However, the OBV has been rising over the past few weeks. It showed steady buying pressure despite the formation of the range.
How much are 1, 10, 100 FTM worth today?
If the OBV continued to rise in the coming weeks, a breakout past $0.6 could push toward $0.85 and $1.1. Until then, buying and selling near the range extremes could be a profitable option for Fantom traders.
A rise in dormant circulation marked the previous local top after holders booked profits
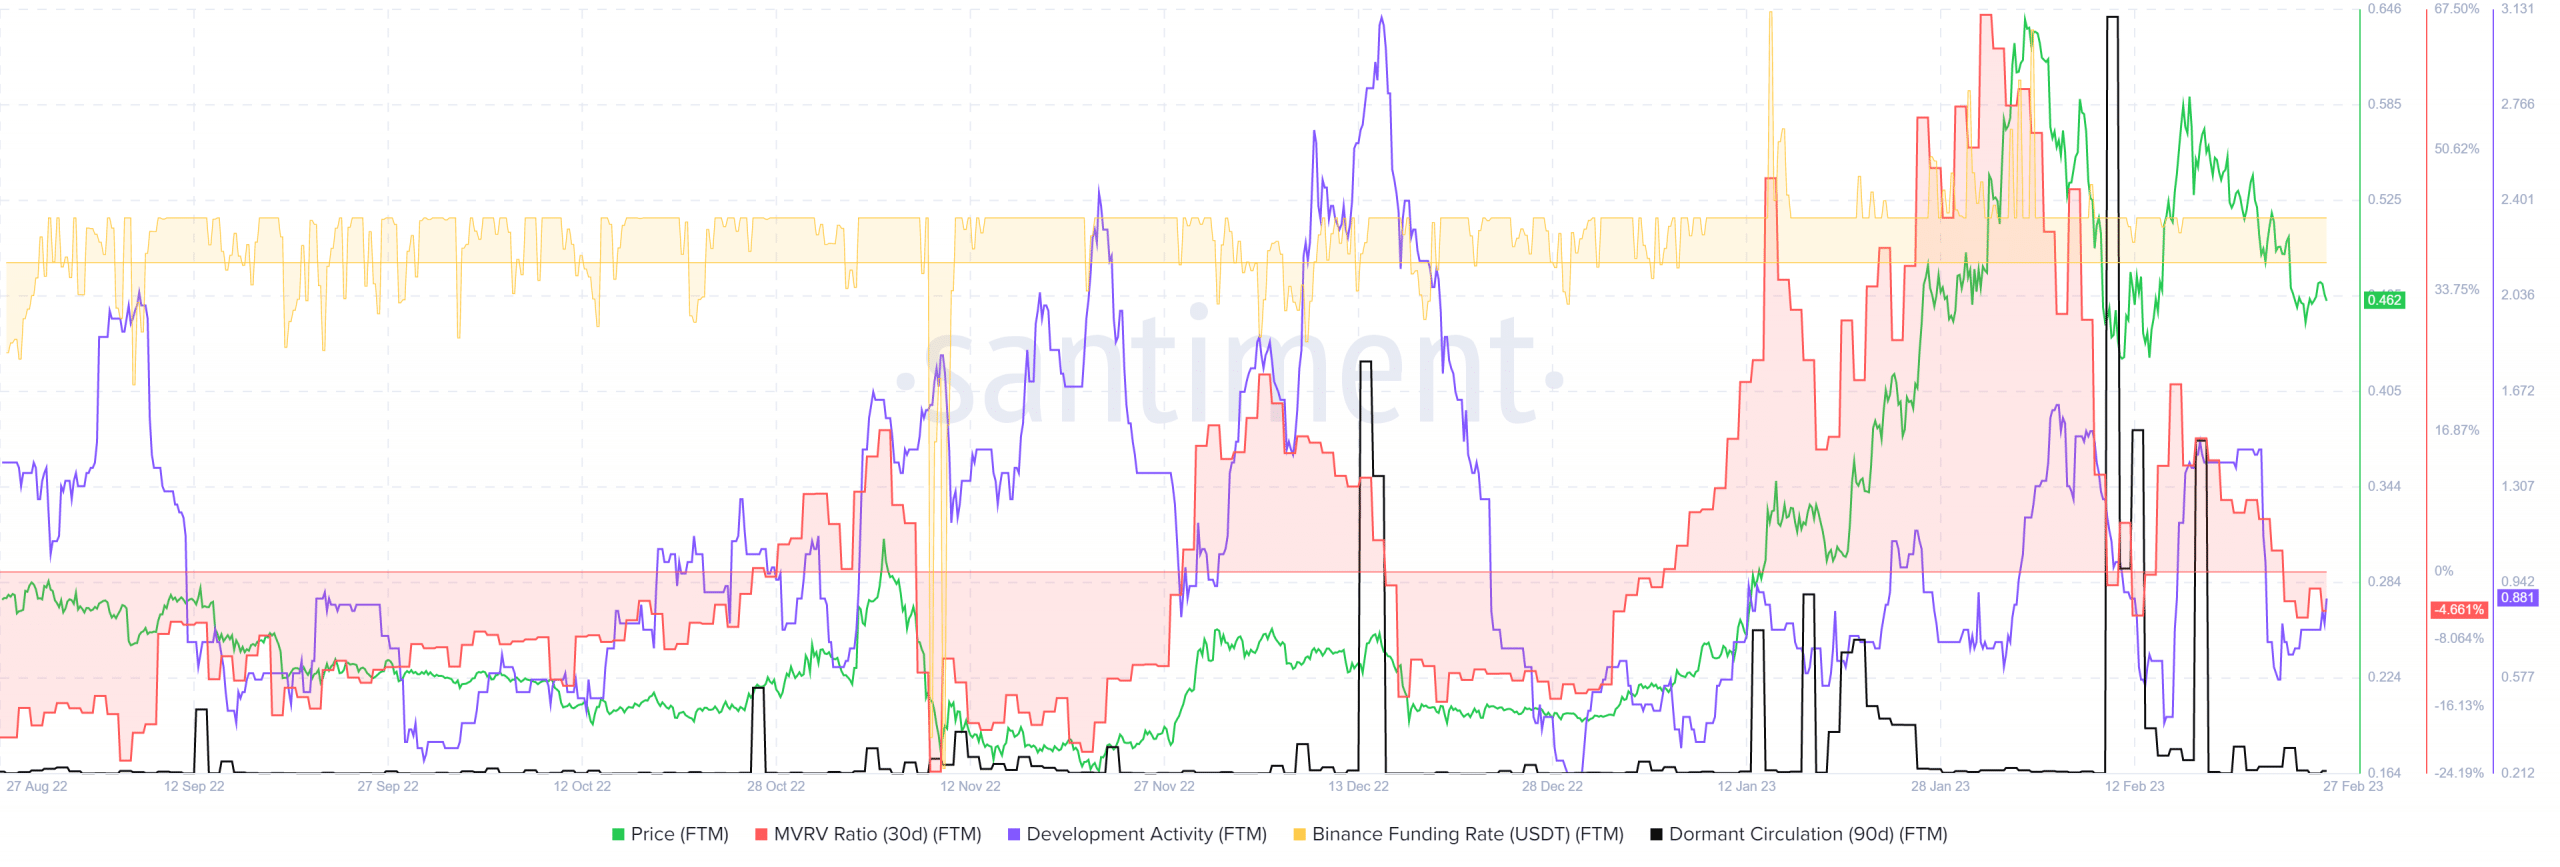
The 30-day MVRV ratio fell into negative territory. It rose to 3-month highs in late January but has plunged lower since then. This indicated holders booked a profit and reinforced the selling pressure seen in recent weeks. Although not strong enough to initiate a long-term downtrend, it was enough to halt the explosive rally.
The 90-day dormant circulation saw a sudden spike on 12 February, and another one on 18 February. The recent spike also marked a local top for FTM.
Therefore, this was another metric traders can keep an eye on to give a warning of large sell-offs. Meanwhile, the development activity was steady and continued without any correlation with the price action, which should encourage long-term buyers.


