Fantom posts 5% gains in the past day but can sellers seize the upper hand soon

Disclaimer: The information presented does not constitute financial, investment, trading, or other types of advice and is solely the writer’s opinion.
Fantom [FTM] appreciated nearly 7% from the lows of the previous trading day. The lower timeframe indicators pointed toward a bullish bias. Yet, caution was desirable, especially for buyers.
Bitcoin [BTC] stood just beneath a stiff resistance zone at $20.8k, and Fantom also faced strong selling pressure at $0.237 in the past week. Owing to the presence of a lower timeframe resistance, a shorting opportunity on the risky side was spotted for FTM. Can the bulls push past nevertheless?
FTM- 12-Hour Chart
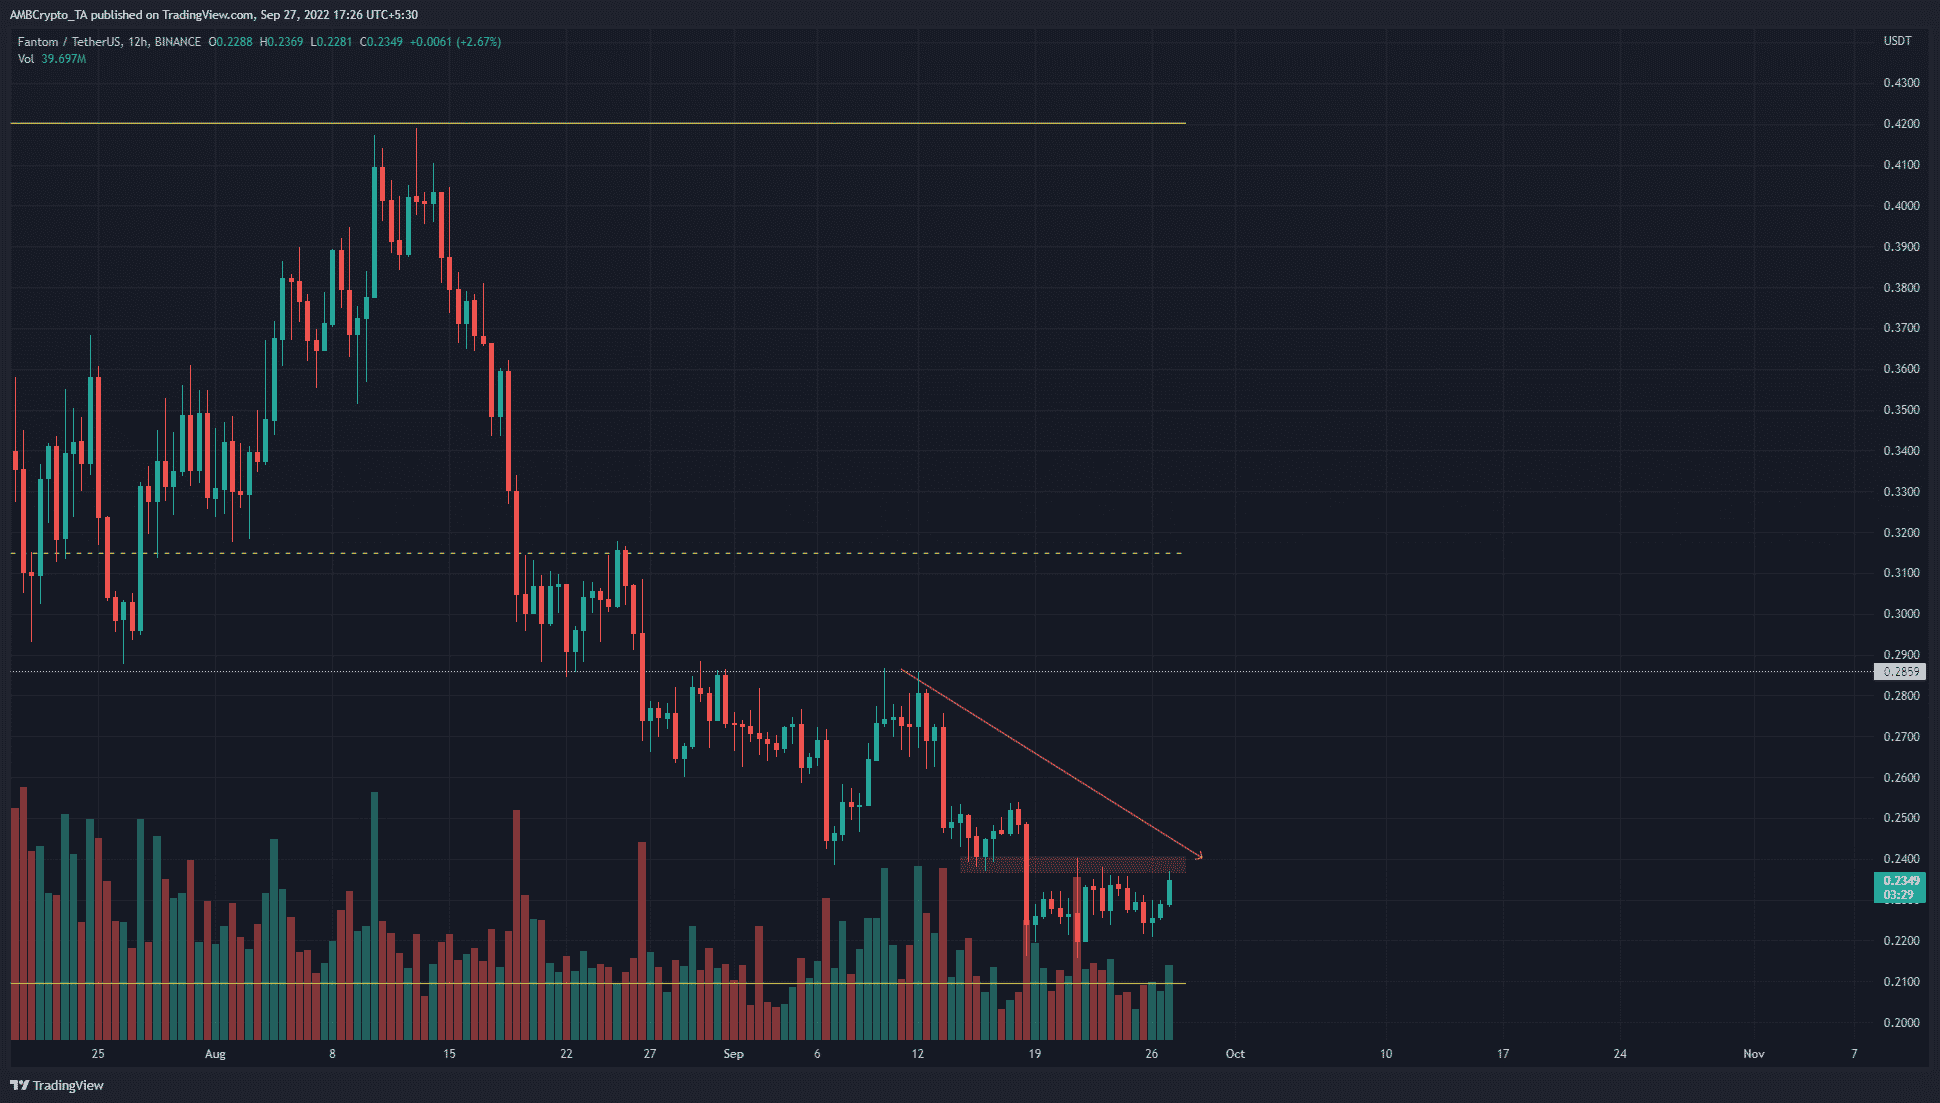
The 12-hour chart showed a strong downtrend in progress. This has been the case since mid-August, when FTM broke below its higher low at $0.37 to test $0.285 as support and retest $0.32 as resistance.
Another factor highlighted on the charts was a higher timeframe range (yellow) from $0.21 to $0.42. The mid-point of this range lies at $0.315 and has served as a support and resistance level numerous times since May.
The downtrend of the past few weeks highlighted that a lower timeframe trader can be bearishly biased.
FTM- 2-Hour Chart
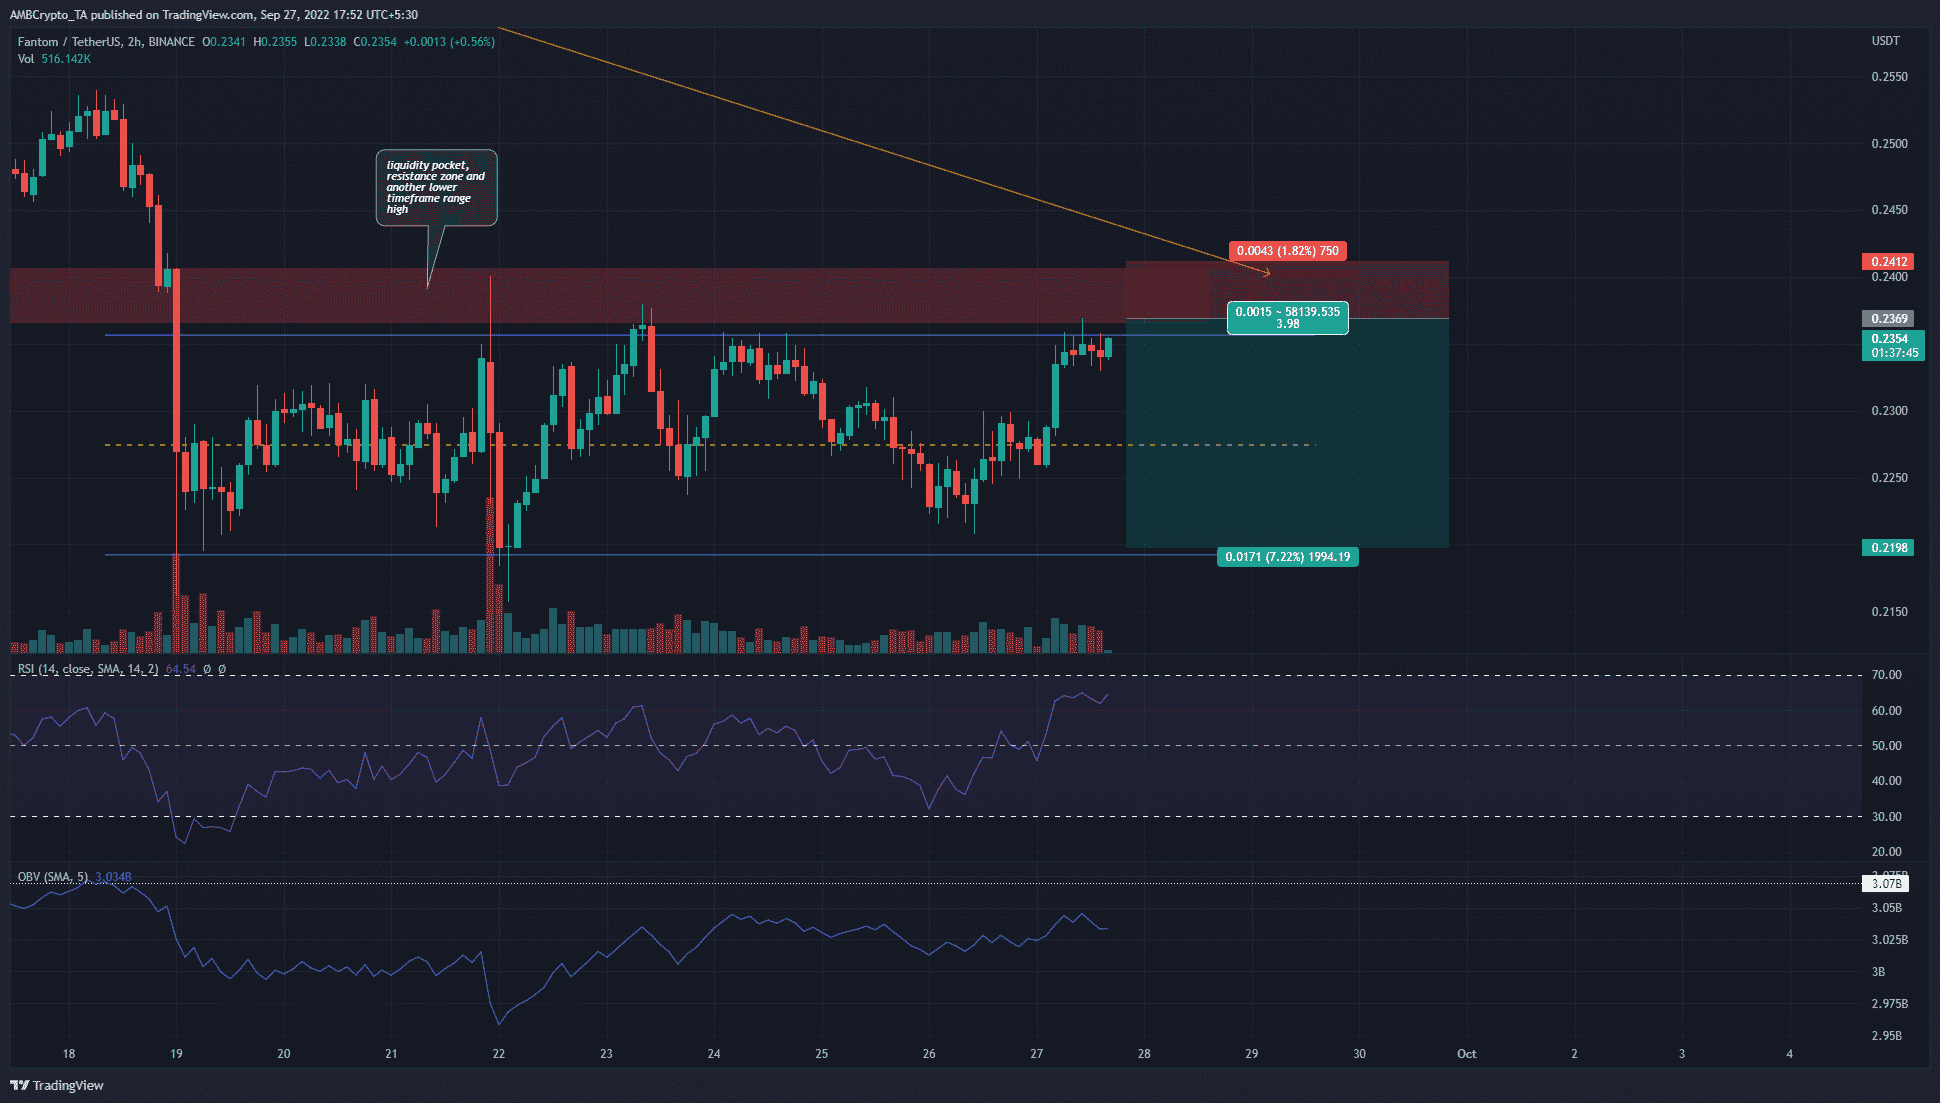
On the two-hour chart, we can see yet another range established. Highlighted in blue, this one reached from $0.235 to $0.219, with the mid-range at $0.227. At the time of writing, the price reached toward the range highs, which had been a stiff zone of resistance over the past ten days.
A breakout was possible, but context could be key here. Bitcoin stood beneath the $20.8k resistance, and FTM was in a higher timeframe downtrend as well. Despite the gains of the past few days, a selling opportunity was around the corner.
The Relative Strength Index (RSI) showed bullish momentum as it surged to 64, but the On-Balance Volume (OBV) only moved sideways over the past week. Hence, even though there was a strong bounce from the range lows, neither the OBV nor the price action pointed toward a decisive breakout yet.
The resistance zone, highlighted in red, acted as support in mid-September. Therefore, it could prove pivotal yet again in the coming hours.
Conclusion
Buying an asset near resistance can work in a strongly bullish market, but Fantom did not possess such a trend. In fact, it leaned toward a short-term range, and a longer term downtrend.
Hence, a low risk short can be opened in the $0.237 area. Invalidation of this bearish notion would be an hourly session close above $0.241. The mid-range value and the range lows can be bearish targets.


