
- The number of FTM whale transactions completed daily has surged.
- The price rally has led to an increase in market volatility.
The daily count of whale transactions involving Fantom [FTM] has risen to its highest level in the last year, indicating growing interest from large investors, according to Santiment’s data.
According to the on-chain data provider, on 7th March, the number of FTM transactions that exceeded $100,000 totaled 147, its highest since the 31st of January, 2022.
Similarly, on 4th March, 10 FTM transactions valued above $1 million were recorded, the highest number since 15th February 2023.
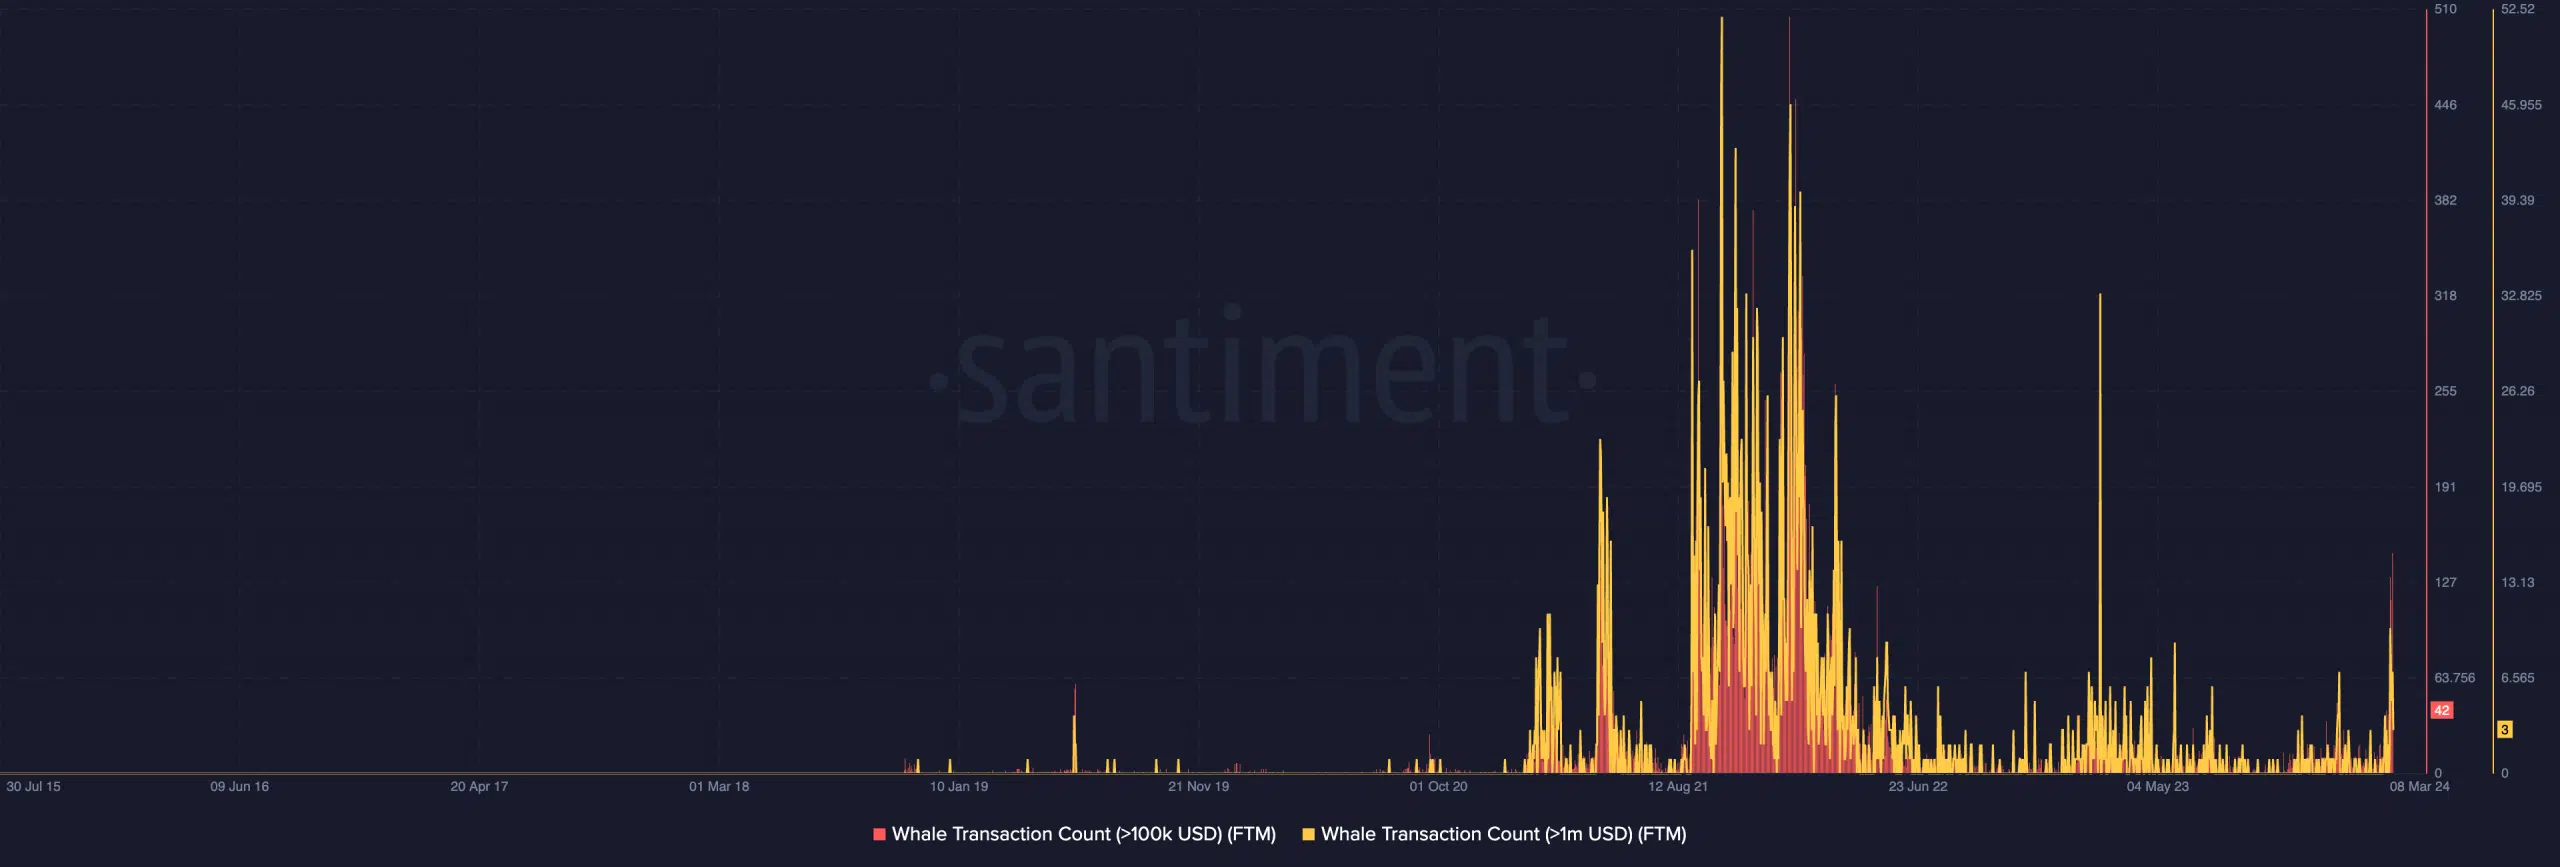
Source: Santiment
AMBCrypto found further that the total amount of FTM held by whales has rallied significantly in the past few weeks. On-chain data showed that the count of FTM whales holding between 100,000 and 1,000,000 FTM coins has increased by 3% since the month began.
For context, this investor cohort comprised 362 addresses on the 1st of March. As of this writing, it was made up of 374 addresses.
FTM reacts positively
A strong correlation exists between an asset’s increased whale activity and its price action. Increased whale buying often leads to a price surge, which has played out in FTM’s case.
At press time, the altcoin exchanged hands at $0.81. In the last month, its value has risen by over 115%, per CoinMarketCap’s data.
AMBCrypto found that the increased activity amongst FTM whales pushed its daily trading volume to a two-year high on 7th March. According to Santiment’s data, the coin’s trading volume totaled $558 million.
This spike in trading activity resulted in the double-digit rally in FTM’s price witnessed in the past 24 hours.
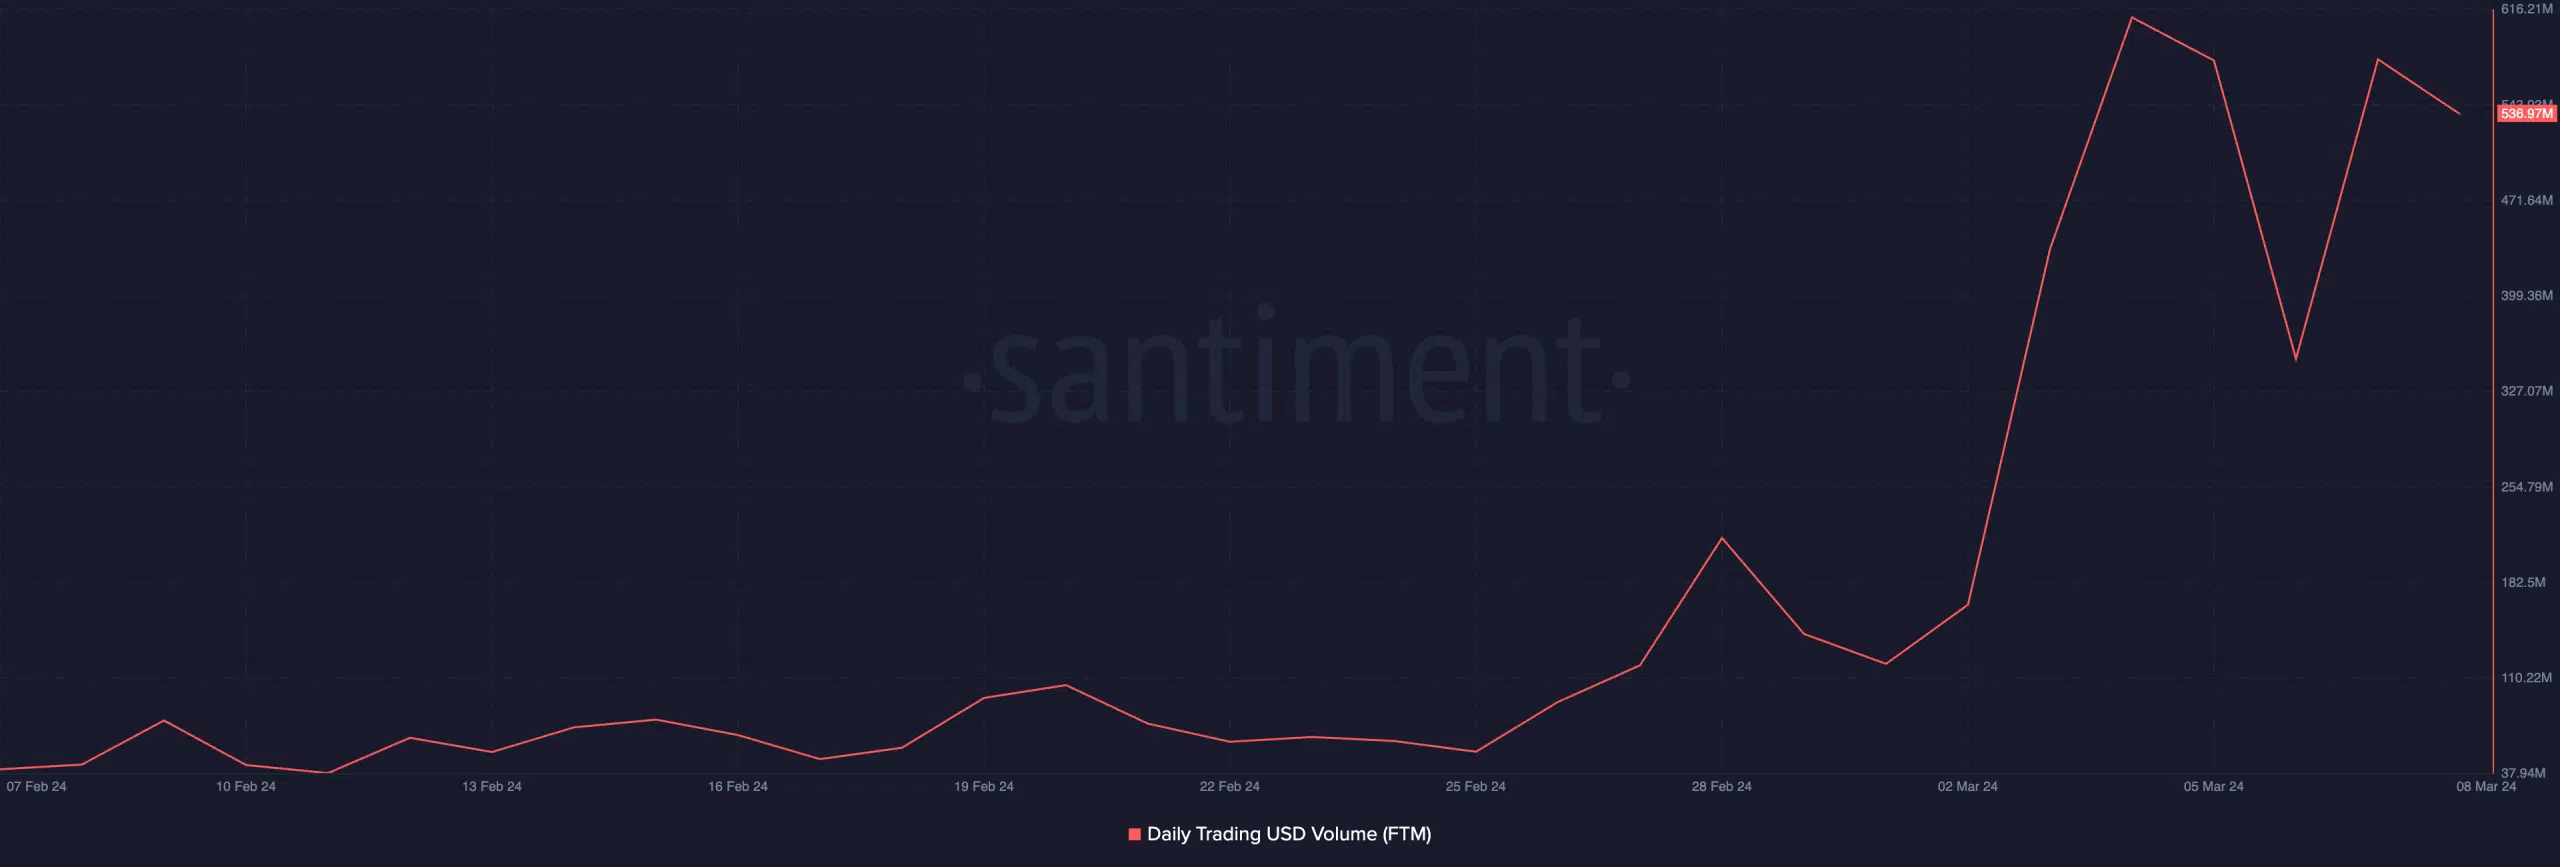
Source: Santiment
FTM’s price movements assessed on a 1-day chart revealed that the demand for the altcoin persisted amongst its spot market participants.
At press time, FTM’s Relative Strength Index (RSI) and Money Flow Index (MFI) were 75.74 and 83.63 respectively. At these values, buying pressure was higher than selling activity.
However, FTM’s 100% price surge in the last month has led to a rise in market volatility. Key volatility markers have rallied significantly in the past few weeks, suggesting that FTM’s price remains prone to significant swings.
Read Fantom’s [FTM] Price Prediction 2023-24
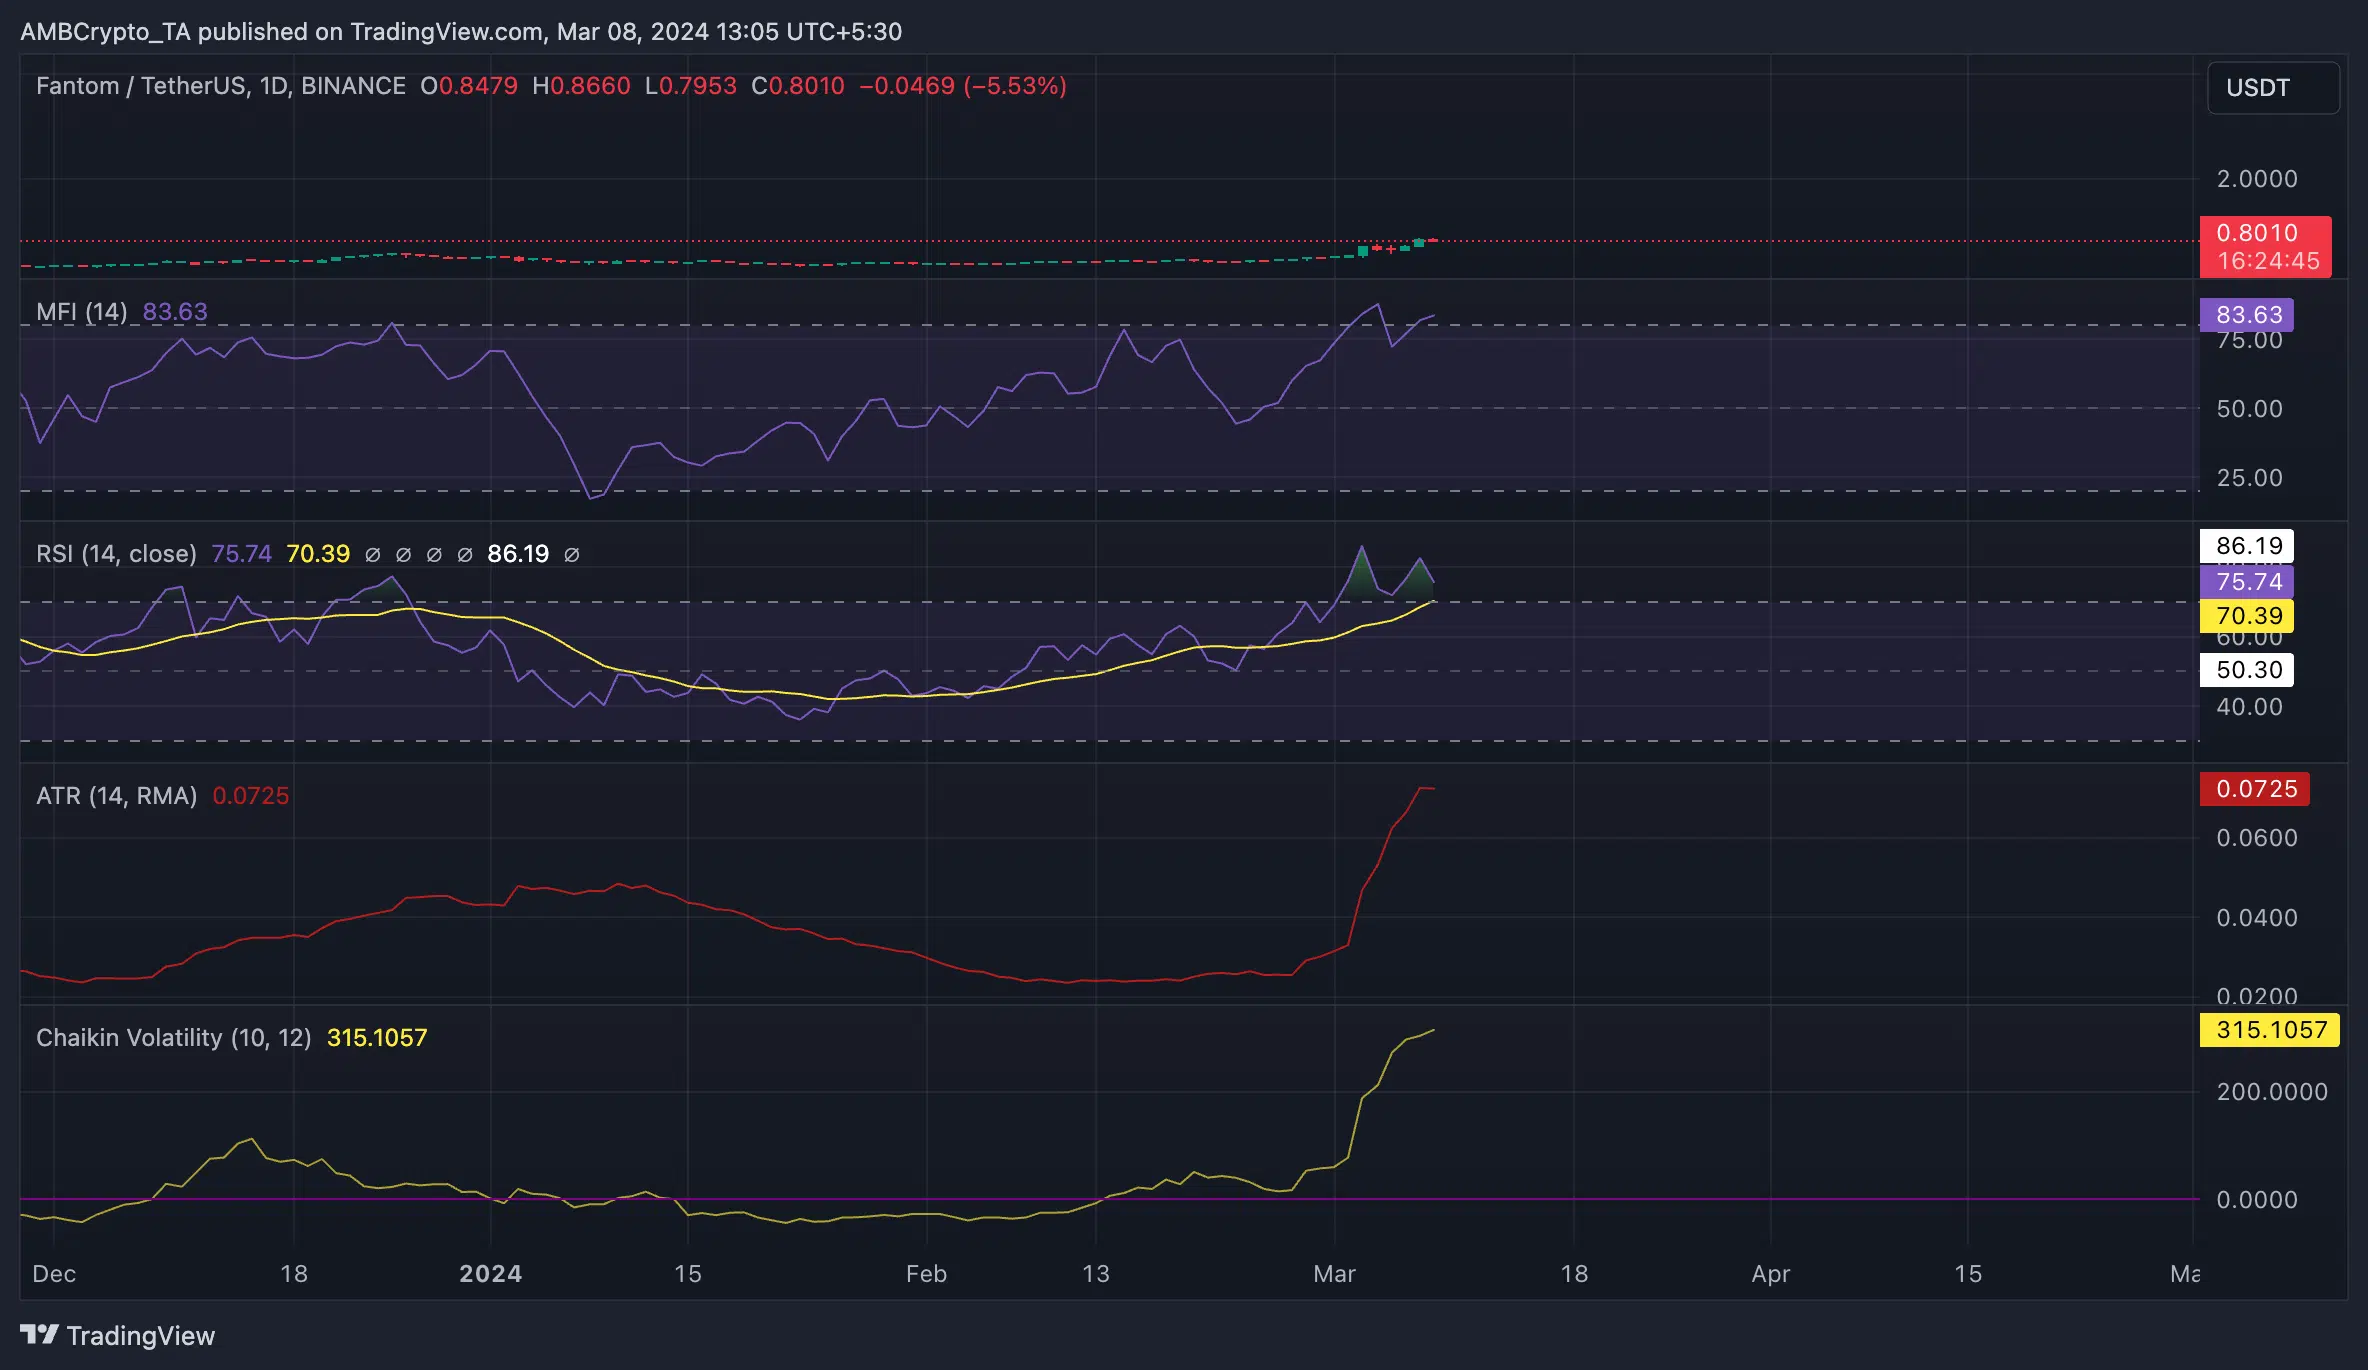
Source: Trading View
For example, FTM’s Average True Range (ATR), which measures its market volatility by calculating the average range between high and low prices over a specified period, was 0.07 as of this writing. It has increased by 250% since March began.
Likewise, the coin’s Chaikin Volatility indicator, which measures the difference between an asset’s high and low prices over a specified period, has increased by 392% since the 1st of March, signaling the hike in volatility.