Fantom’s 7% slide: A minor correction ahead of a bull run?
The OBV raced upward to highlight the dominance of buyers. Trading volume was also high.

- Fantom has a strongly bullish market structure on the 12-hour chart.
- A drop below $0.9 this week does not seem likely based on the evidence at hand.
Fantom [FTM] maintained a bullish outlook on the price charts. Even though Bitcoin [BTC] fell 5% in the past 48 hours, FTM was up nearly 17% over the past week even after the recent rejection at $1.22.
An AMBCrypto report earlier this week highlighted that FTM was viewed positively in social media. Yet, its supply on exchanges metric saw an uptick, which was a sign of rising selling pressure.
The retracement was not yet in full swing
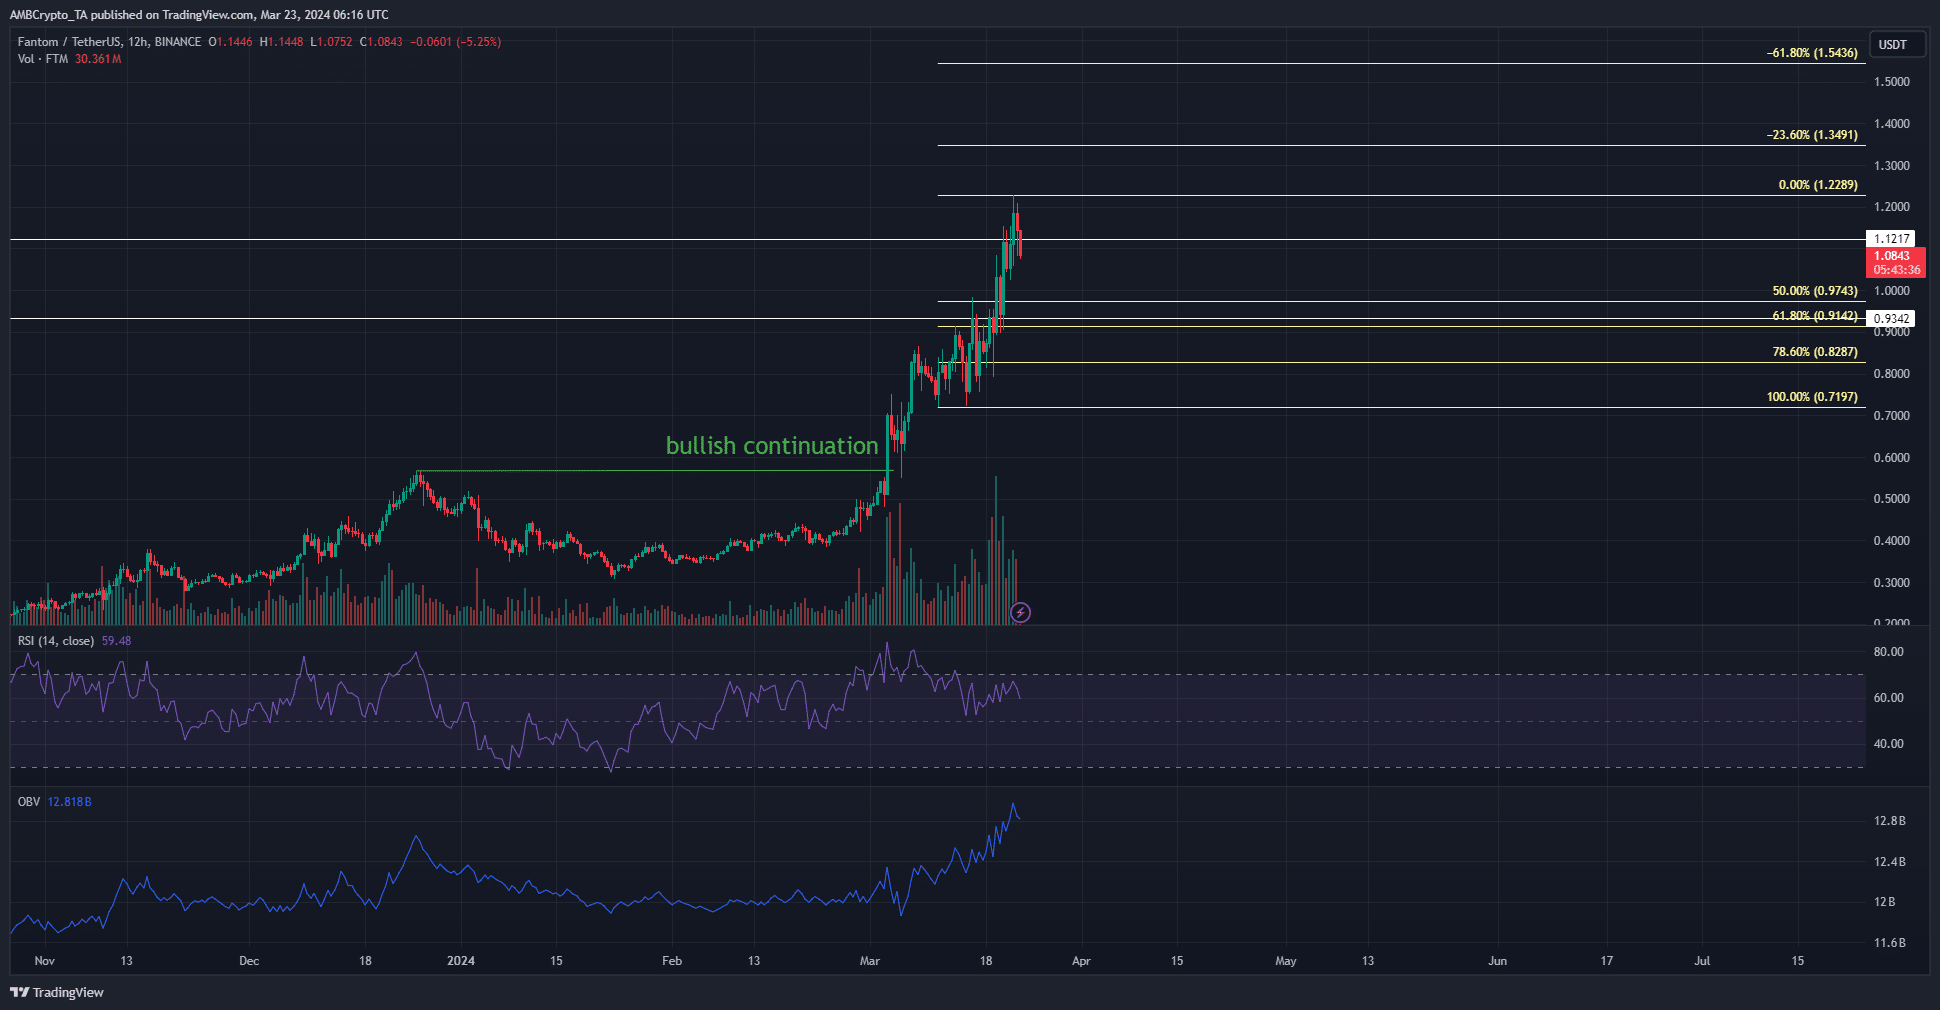
FTM saw a lower timeframe rejection at $1.2289 on 22nd March. Based on its rally to this level from $0.7197 over the past eleven days, a set of Fibonacci retracement levels (pale yellow) were plotted.
The market structure was bullish. The higher low of the current uptrend was at $0.7197. Hence, a drop below this level would shift the structure bearishly on the 12-hour timeframe. The RSI made a bearish divergence with the price earlier this month, but this was no longer the case.
At the same time, the OBV trended furiously higher to highlight the dominance of buyers. Trading volume was also high. Therefore, there is a chance that FTM could push higher beyond $1.22 over the weekend.
However, if the prices do dip, a retest of the $0.83-$0.915 zone would present a buying opportunity for swing traders.
FTM bulls could see some relief in the next few hours
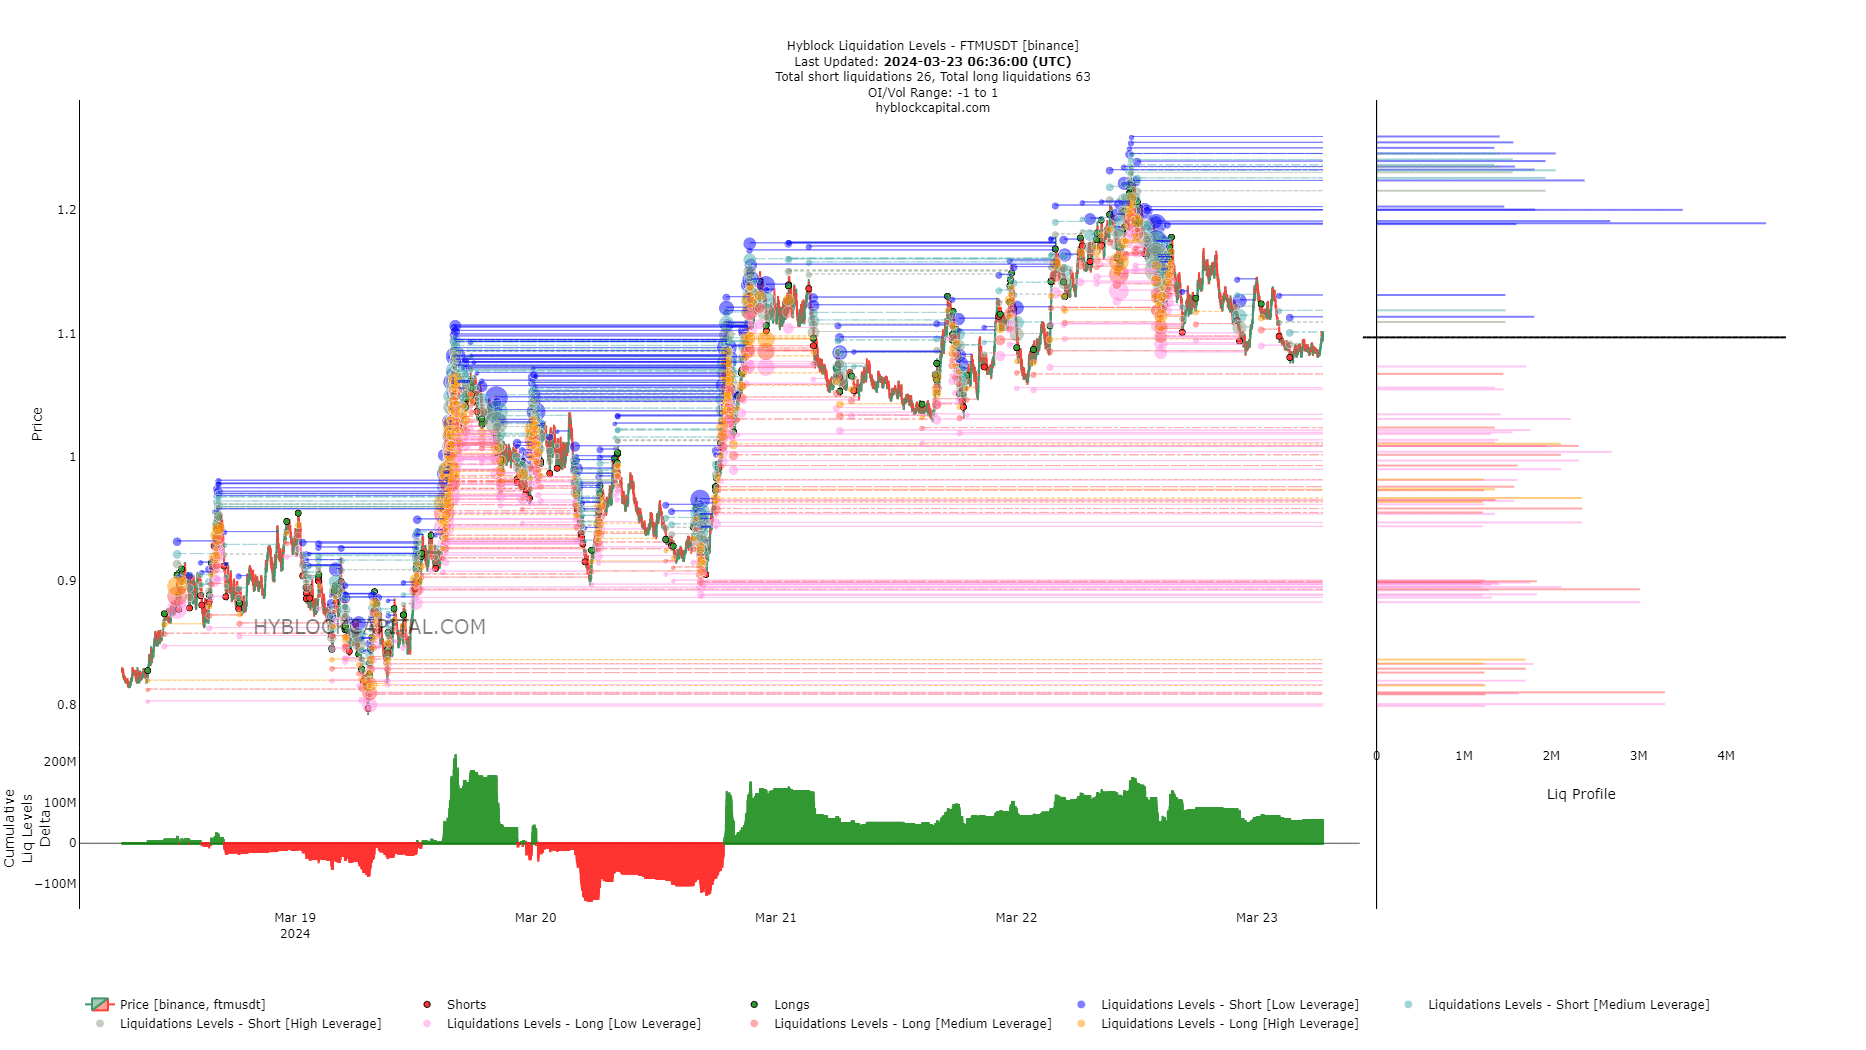
The cumulative liquidation levels delta was positive, but not overwhelmingly so. This showed that the long liquidations were more numerous.
Is your portfolio green? Check the Fantom Profit Calculator
However, it might not be enough to demand prices correct violently to collect liquidity from them.
To the north, the $1.18-$1.2 area could see a bearish reaction from Fantom. On the other hand, the $0.97-$1.01 was expected to serve as support. Similarly, other support levels include $0.89 and $0.8.
Disclaimer: The information presented does not constitute financial, investment, trading, or other types of advice and is solely the writer’s opinion.