Few metrics why investors are right to be bullish about SAND

Like a few altcoins, SAND’s price falls in the rebellion coins category. These altcoins are generally correlated to Bitcoin, but at times, they decouple, resulting in a massive move. Recent on-chain metric observations suggest that it could finally be SAND’s time for such a rally.
Sell-side pressure continues to dissipate
For some time, Cardano was in a rebellious phase. After ADA, there were the Metaverse tokens like Sandbox, Decentraland, Enjin Coin, and so on – Each of which saw massive gains. However, looking at the on-chain metrics, SAND could be due for such an exponential move.
The first and perhaps the most significant on-chain metric that supports this view is the supply on exchanges. This on-chain index gives an outlook on the potential sell-side pressure of a particular asset.
The higher the supply on exchanges, the higher the selling pressure and the resulting crash. The number of SAND tokens held on centralized exchanges dropped from 543.6 million to 464.8 million. This indicated that roughly 78.8 million SAND tokens have left the exchanges.
The decline indicates that these investors are bullish on the price performance of The Sandbox in the coming days.

Metrics 1, 2, and 3 say…
Further underlining the interest among investors is the recent uptick in the number of one-hour active addresses from 137 to 1,385 between 20-23 February. This sudden 10x in the number of active addresses indicates that investors are interested in SAND at its current price levels and are likely accumulating it.

While these two metrics point to a possibility in the future, the funding rate gives a real-time picture of the current sentiment of investors. From 1 February to 25 February, the funding rate for SAND surged from -0.007% to 0.01%.
This flip of the funding rate from a negative value to a positive one suggests that the sentiment has shifted from bearish to bullish. As more market participants continue to hedge on SAND, this value will continue to rise higher.

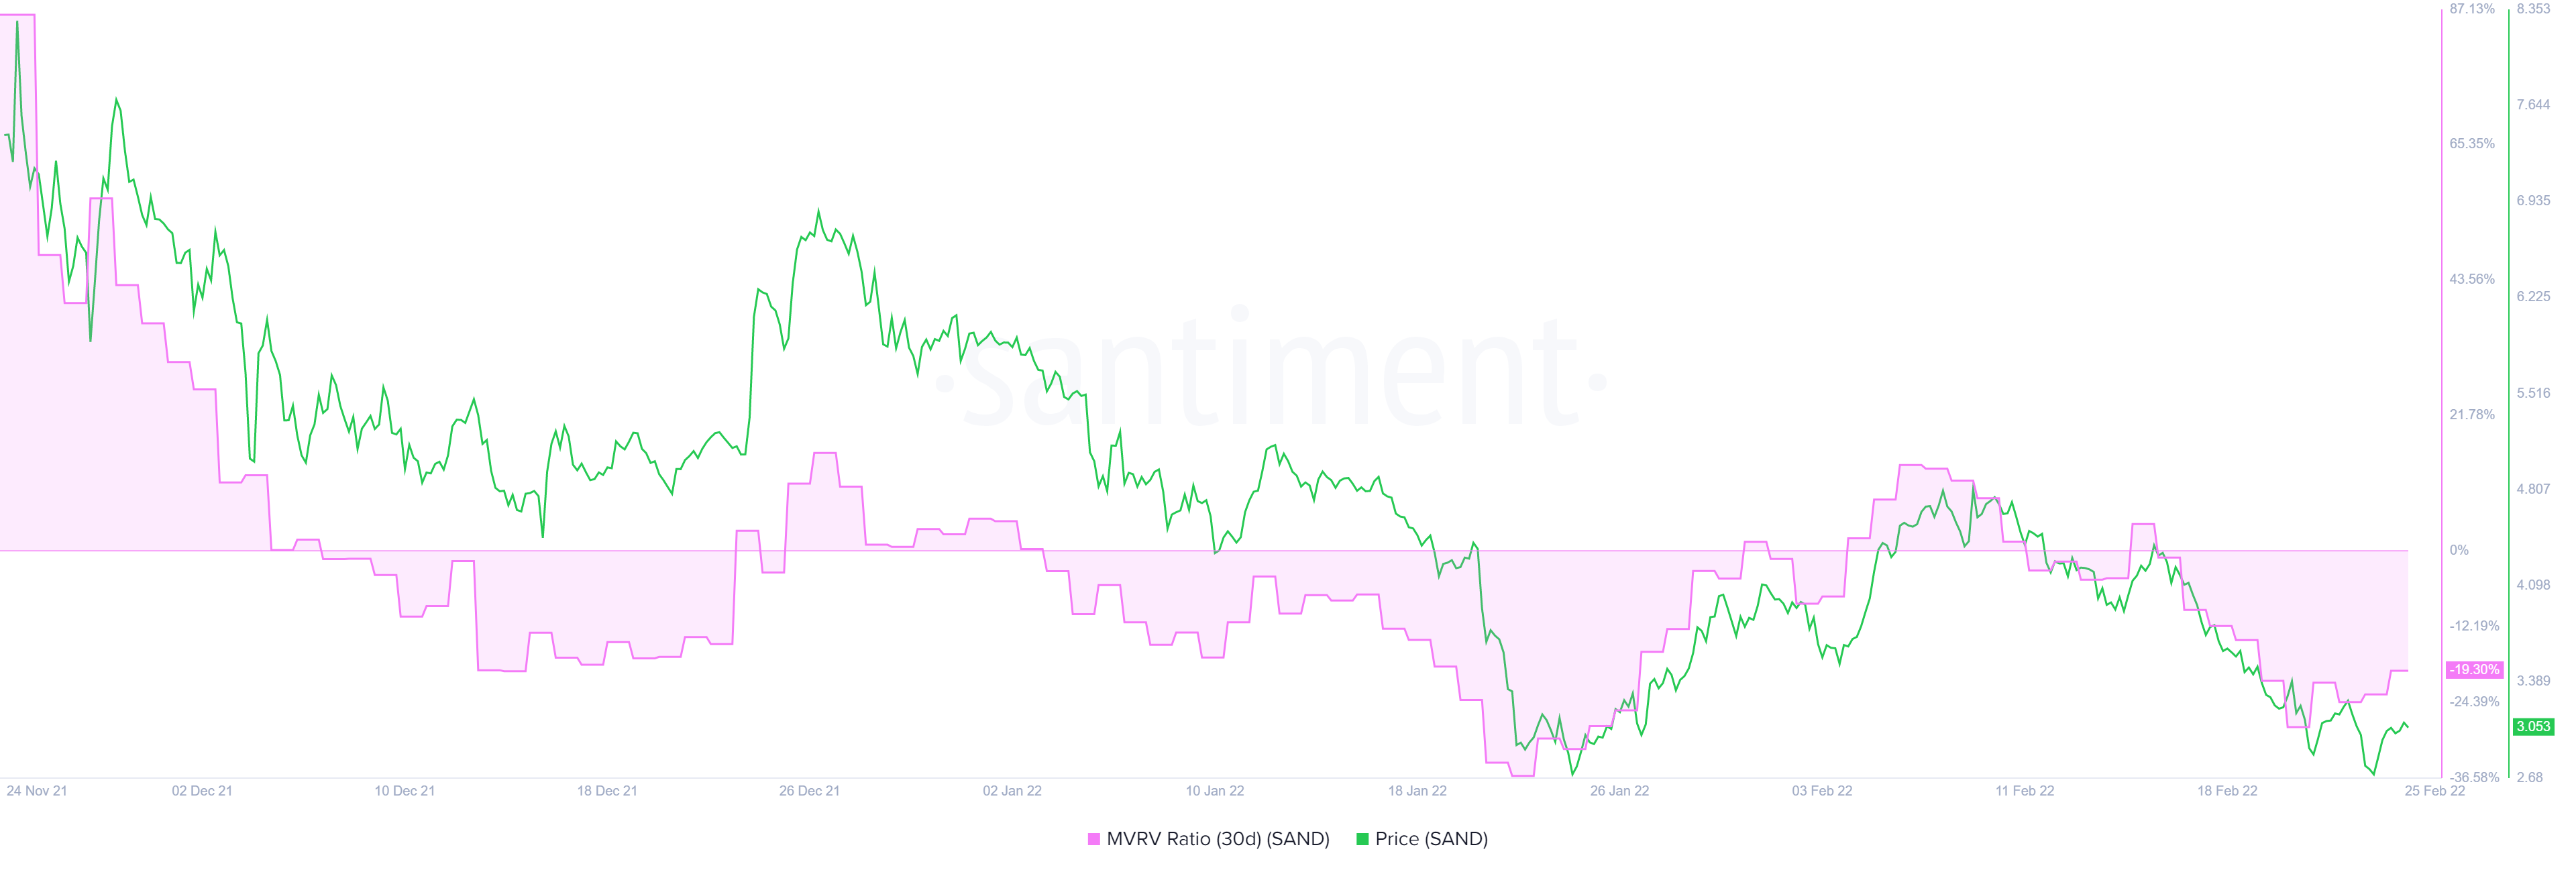
Finally, sealing the deal for the bullish future of SAND is the 30-day Market Value to Realized Value (MVRV) model. This indicator is used to assess the average profit/loss of investors who purchased SAND over the past month.
A value below -10% indicates that short-term holders are selling SAND at a loss. This is likely when long-term holders accumulate, making it an opportunity zone.
At the time of writing, the MVRV for SAND hovered around -19.3%, suggesting that a bullish outlook may be around the corner.
An overview of these metrics suggests renewed interest in SAND from investors, further enforcing the idea of a massive bullish outlook.