Filecoin: Why a recovery to $3.5 seems evasive
The technical indicators of Filecoin and its price action showed a long-term downtrend was in progress and the buyers lacked conviction.

Disclaimer: The information presented does not constitute financial, investment, trading, or other types of advice and is solely the writer’s opinion.
- Filecoin has experienced a long-term downtrend over the past ten months.
- The lack of demand meant bulls were unlikely to defend the psychological support for much longer.
Filecoin [FIL] has been in a downtrend on the 1-day chart since early August. On the higher timeframe charts such as the weekly, this bearish outlook was much stronger, with a downtrend in progress since November 2022.
Read Filecoin’s [FIL] Price Prediction 2023-24
The network operates within a niche market that is the decentralized storage in the crypto space, which could be a positive for FIL long-term. However, the price action hinted at further losses throughout 2023.
The $3 support zone was under pressure once more
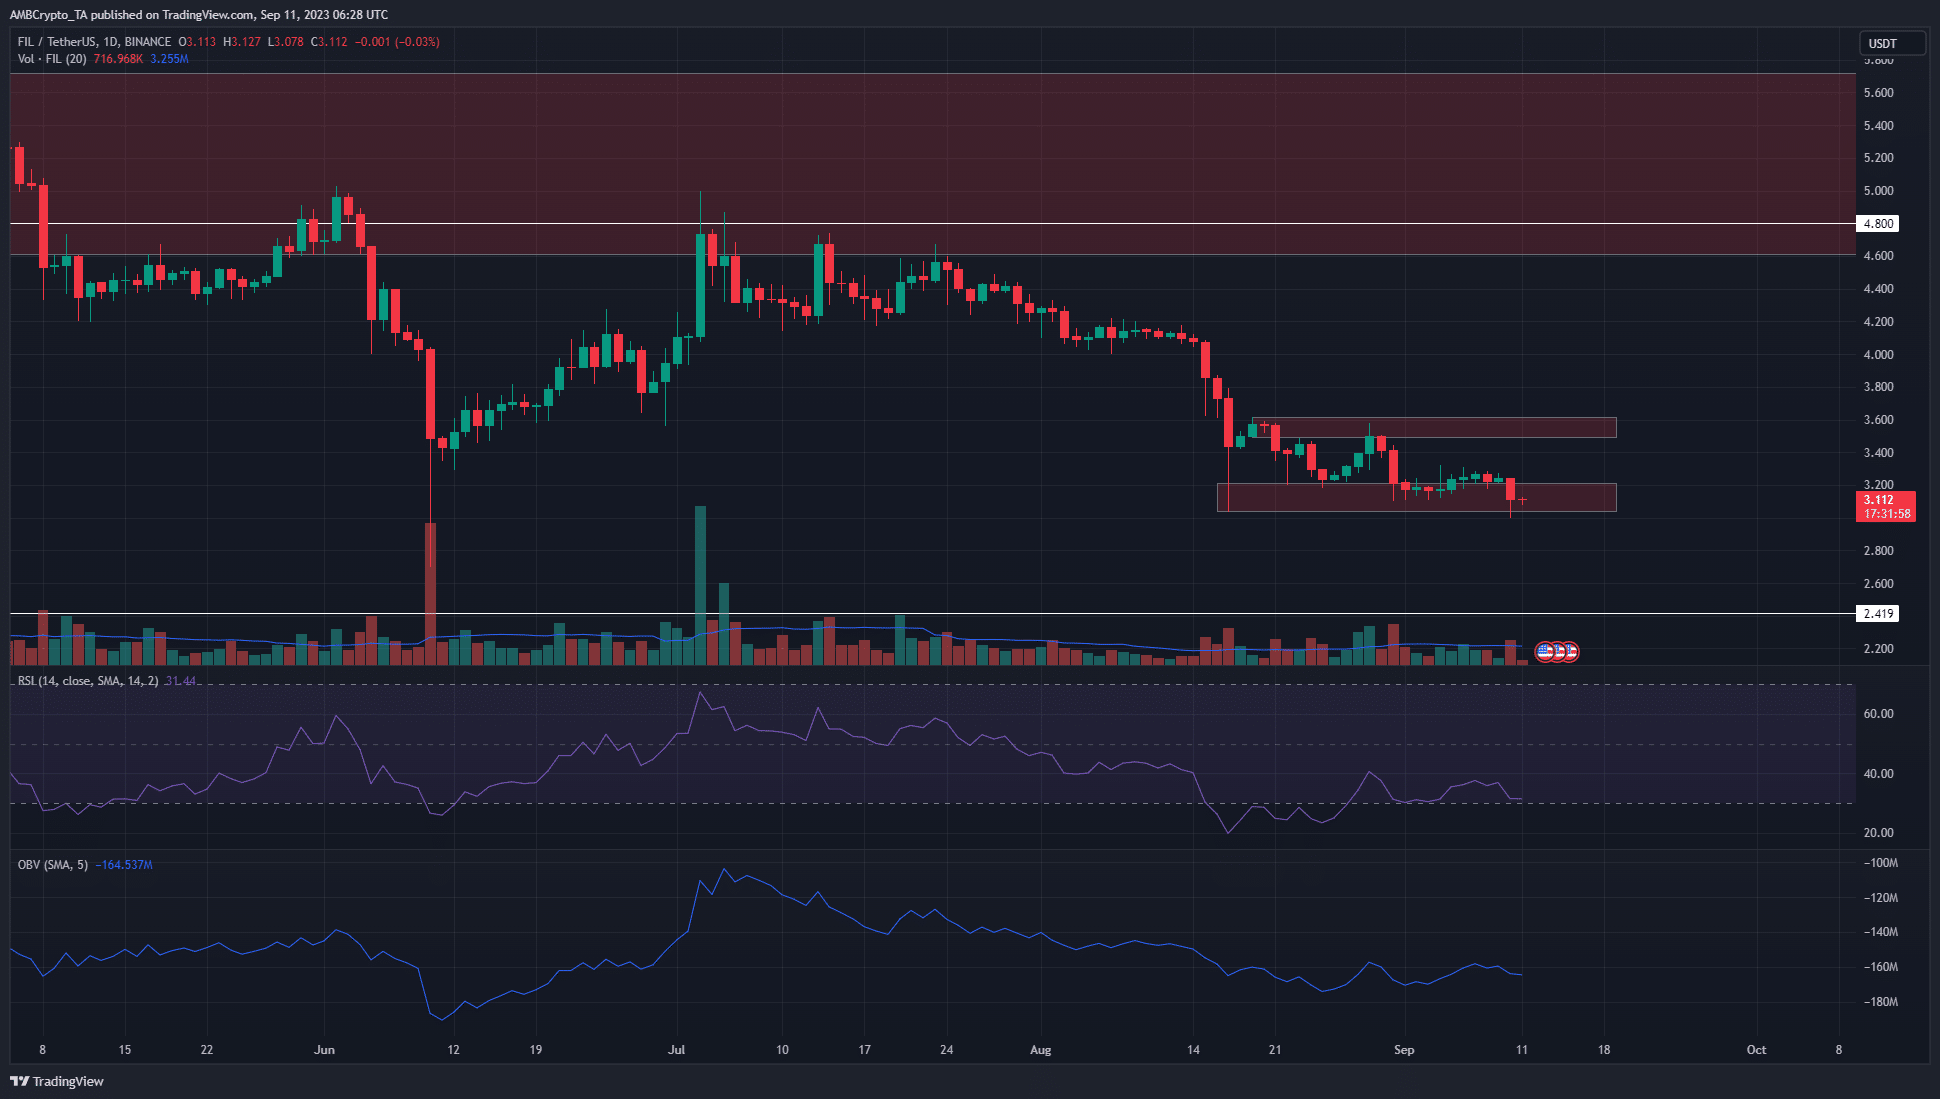
The weekly chart noted two levels of importance for FIL. The resistance at $4.8 and the support at $2.42 were levels that have been significant since June 2022. A breakout past $4.8 would be the first step in establishing a long-term uptrend, and the existence of a bearish breaker block on the 1-week timeframe from $4.6-$5.7 reinforced this idea.
The 1-day chart above showed a bearish order block at $3.6, and a zone of liquidity at $3 that has been tested multiple times over the past month. At the time of writing, the market structure was bearish due to the series of lower highs and lower lows since early August.
The RSI showed bearish momentum with a reading of 31 and has been below neutral 50 since late July. The OBV has also trended downward since mid-July, showing consistent selling pressure. Taken together, it was likely that FIL would drop below $3 and move toward $2.4 in the coming weeks.
Is your portfolio green? Check the FIL Profit Calculator
The Open Interest chart saw a brief spark of bullish sentiment
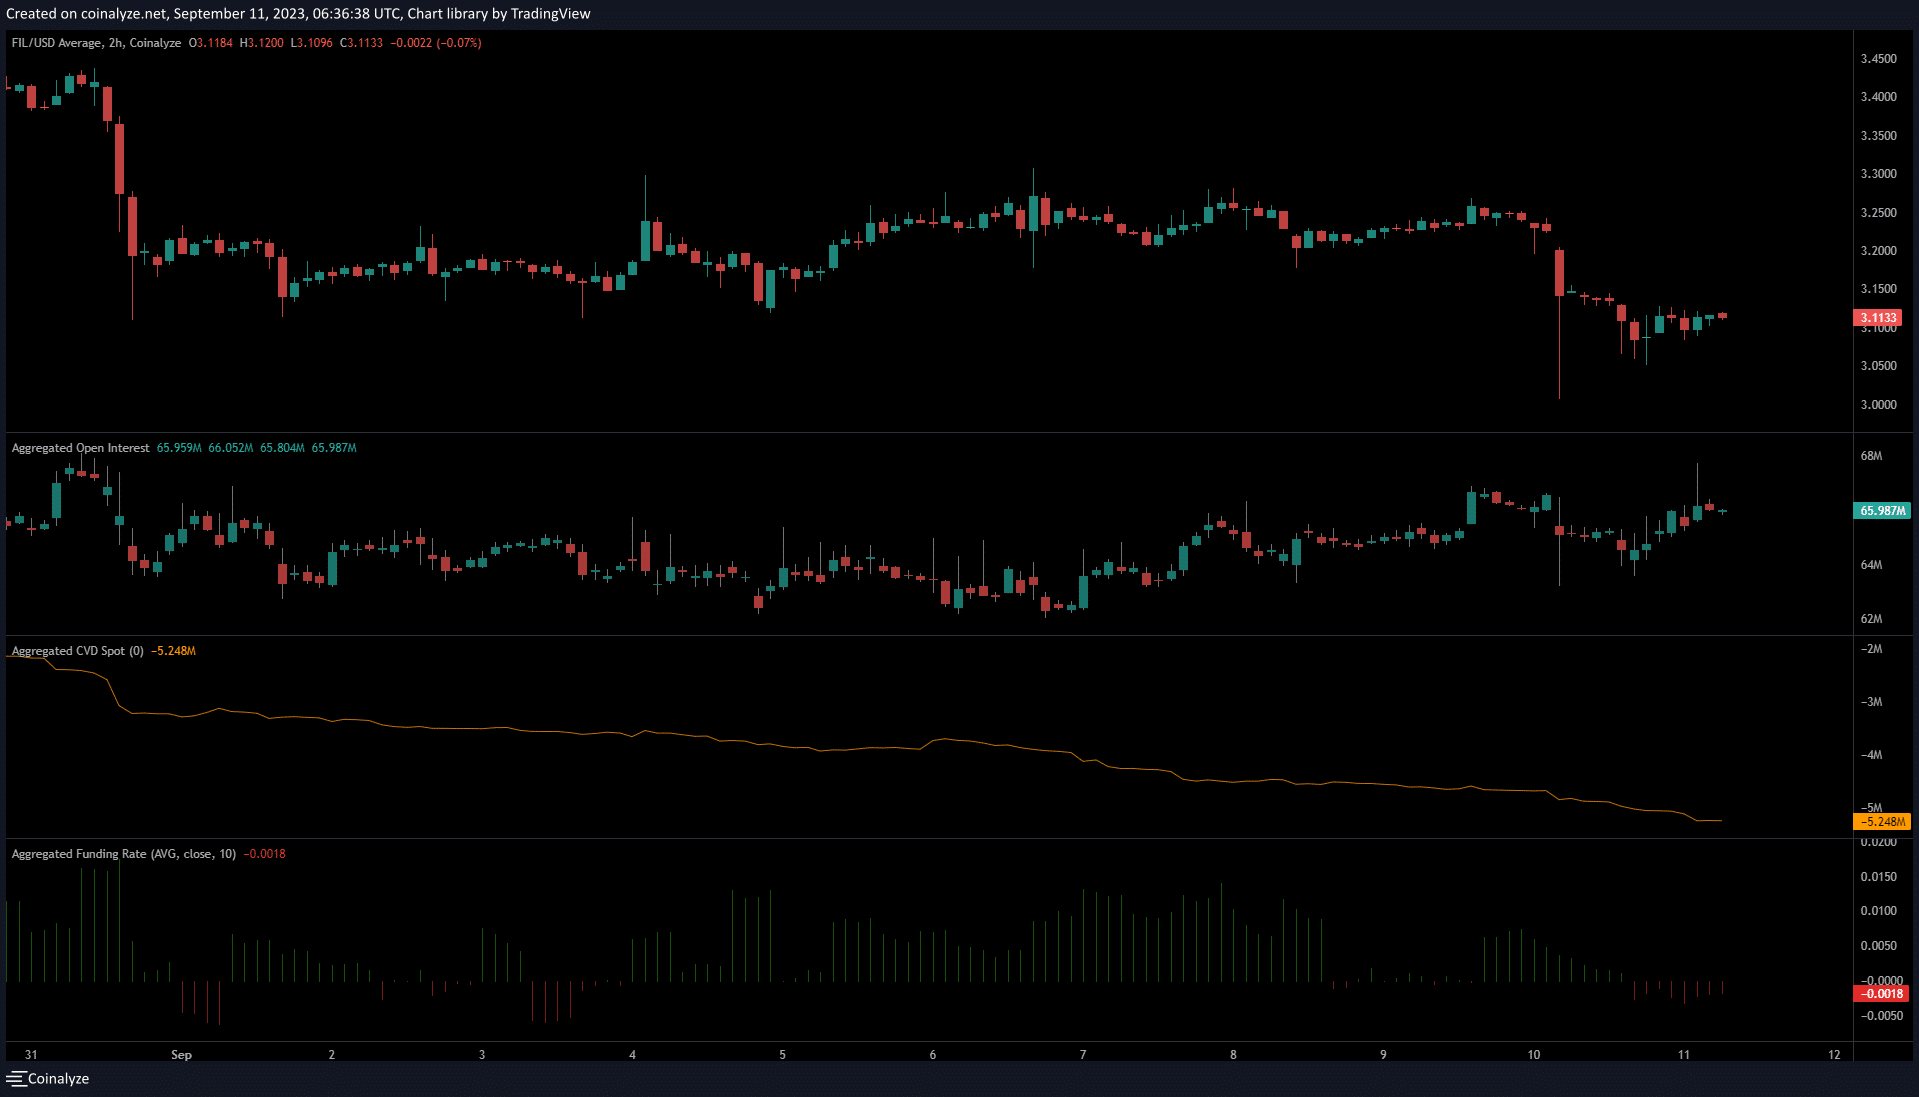
On 7 September FIL was trading at $3.25. The bulls continued to face resistance at the $3.25-$3.3 region till 9 September but the OI began to climb higher. This showed bullish speculators were bidding and reflected some positive sentiment.
Their hopes were dashed on 10 September when prices plummeted to $3. The funding rate flipped negative in the past 12 hours, showing short positions formed the majority. The spot CVD continued to trend downward as well, signaling bearish pressure.


