Axie Infinity: Risk would be to buy range lows with a stop-loss at…

Disclaimer: The findings of the following analysis are the sole opinions of the writer and should not be considered investment advice.
For Bitcoin [BTC], the entire region from $20.8k to $21.8k presented stiff resistance. In the past two weeks, the price saw a minor bounce from this area to test $23k as resistance, before promptly falling beneath this zone again. This meant that many altcoins also attempted to bounce higher and break the market structure but failed. Axie Infinity [AXS] was one such token.
AXS- 1 Day Chart
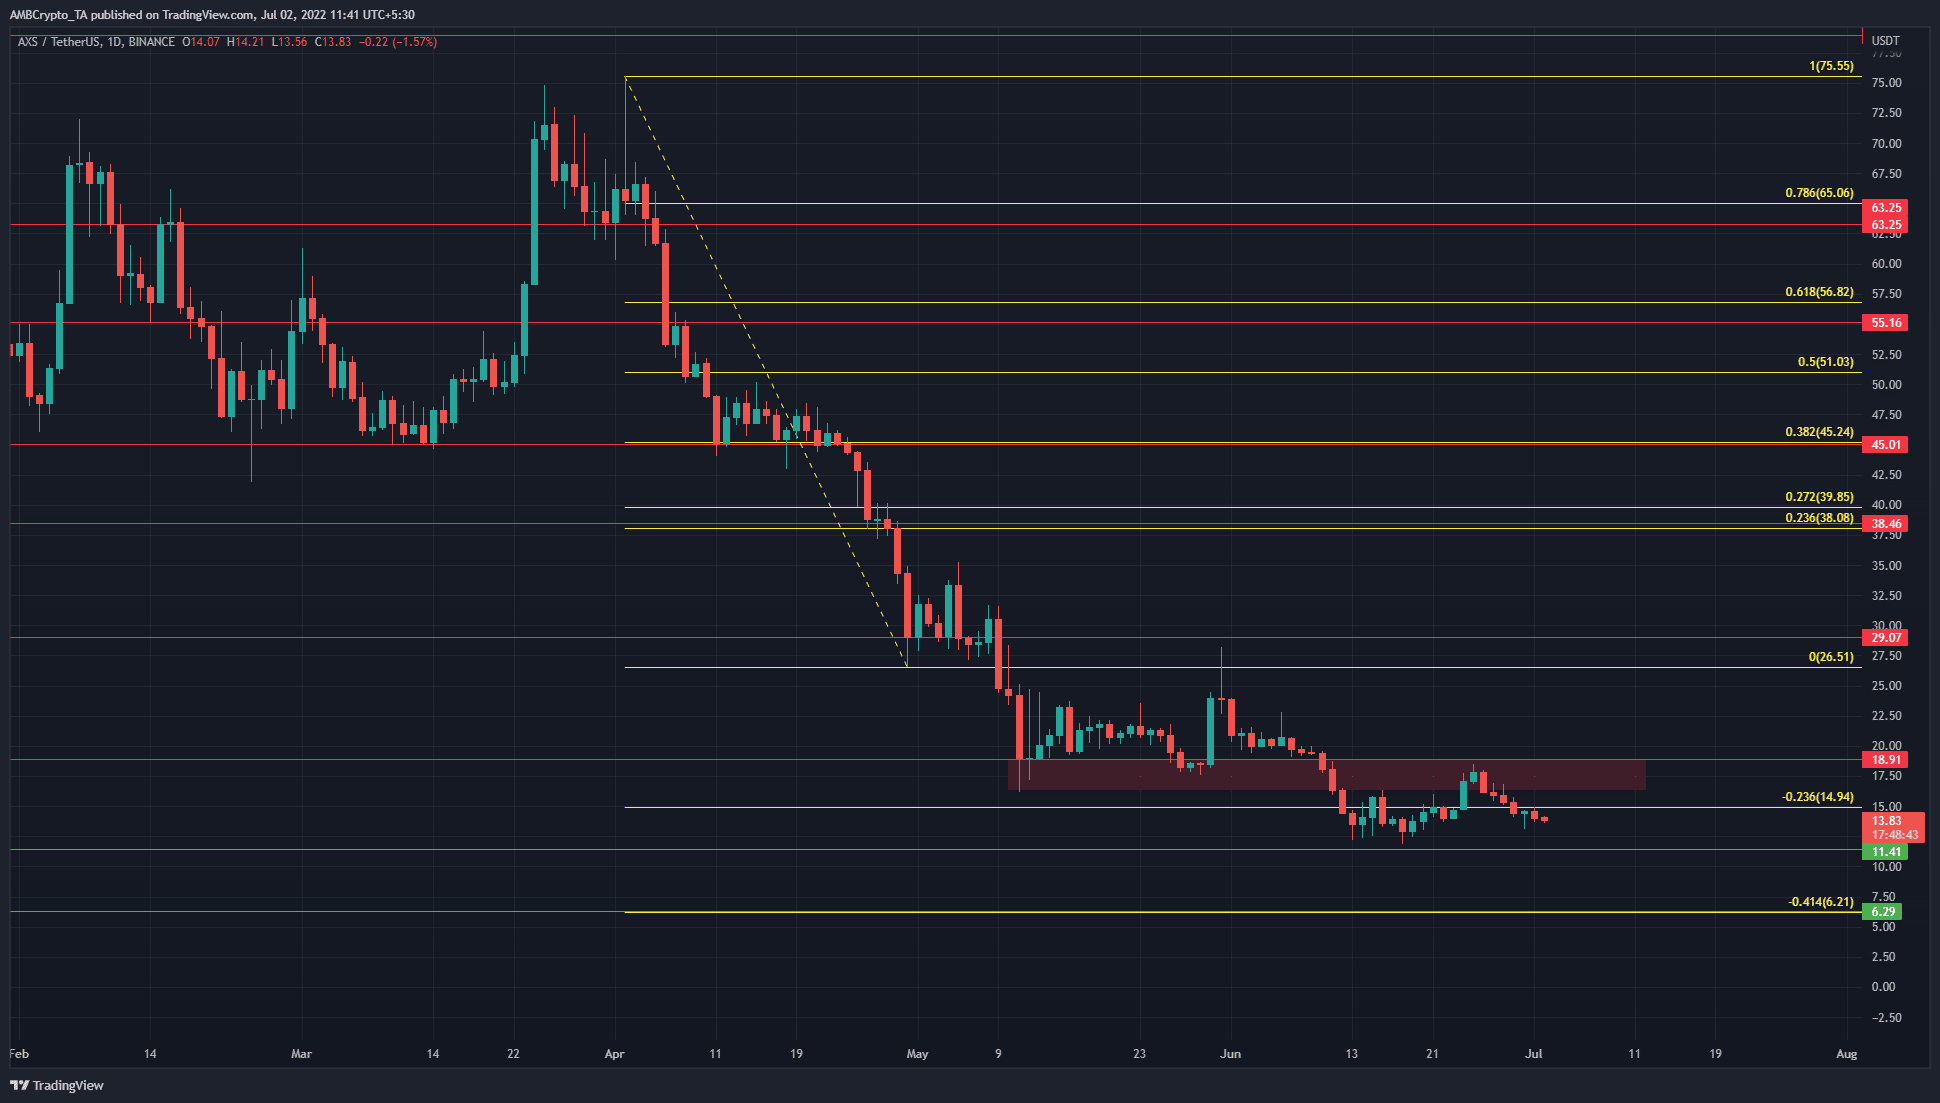
From mid-May to early June, the $18 zone (red box) had served as support for Axie Infinity on the price charts. However, a wave of selling pressure saw the token careening beneath this area, to dip as low as $11.9.
In the past few days, a lower timeframe rally saw AXS retest the $18 resistance zone. AXS faced rejection and the bearish momentum took over once again.
However, on lower timeframes, a range appeared to form between $12.3 and $18.4. Since the $11.4 was also long-term horizontal support, there was some confluence between the range lows and a support level. A risky venture would be to buy the range lows as support, with a stop-loss beneath $11.4.
Rationale
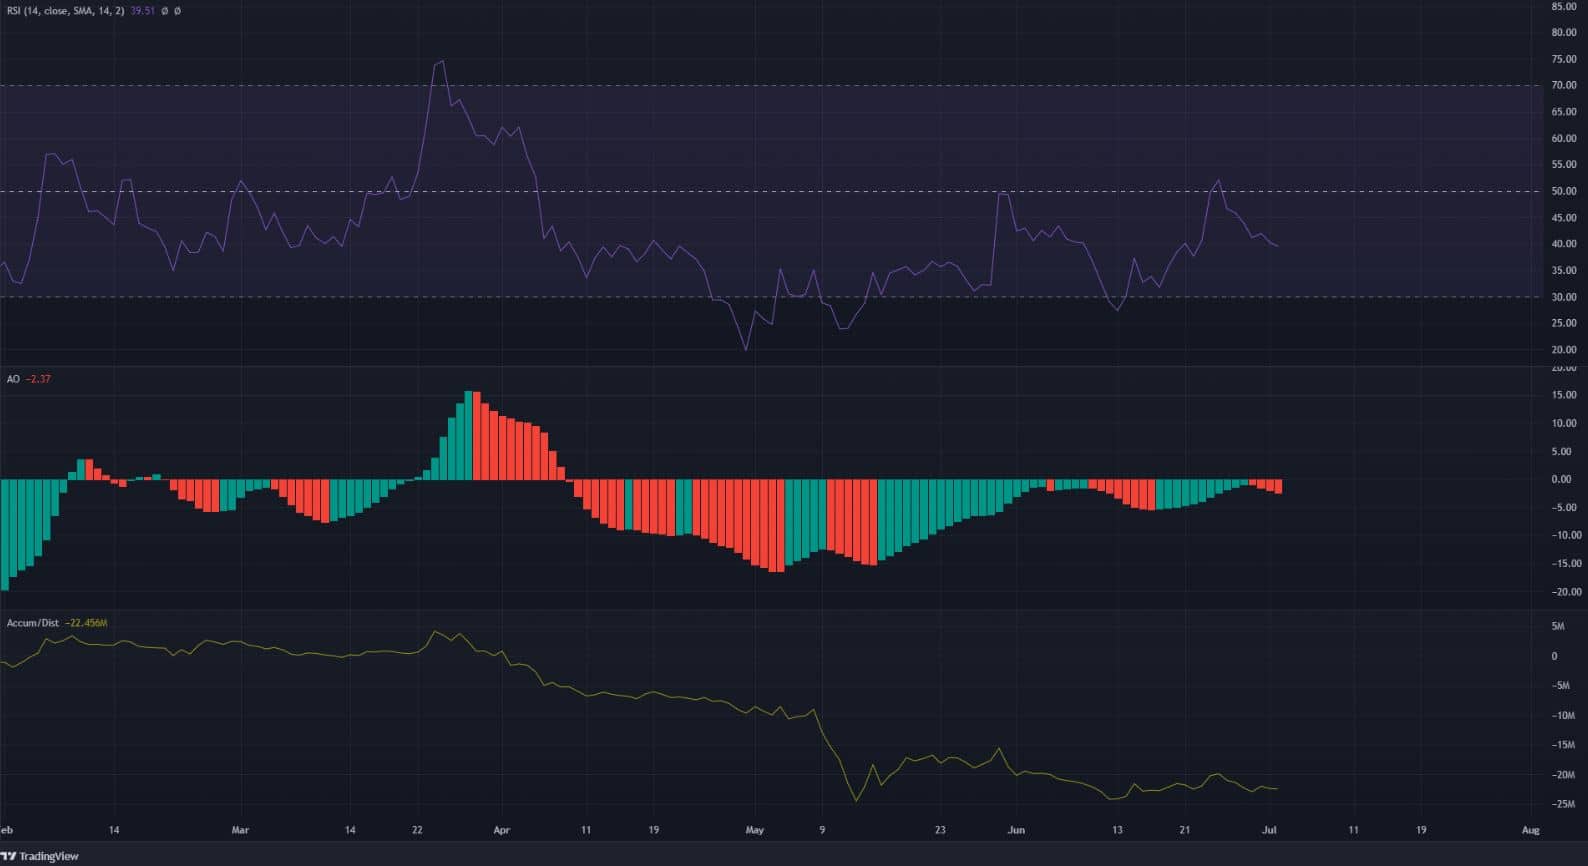
The Relative Strength Index (RSI) has been below neutral 50 since April, and the Awesome Oscillator (AO) was also beneath the zero line. This showed a strong bearish trend. In the past few days, the RSI also retested the neutral 50 level as resistance before being forced to move lower.
Therefore, the trend continued to favor the bears, and another move to the south remained likely. The $11.4 and $6.3 levels could be tested as support in the weeks to come. The A/D line was also on a downtrend to highlight intense selling pressure in the past few months. Demand was not high, and a reversal of the long-term downtrend appeared unlikely.
Conclusion
To break the market structure and regain a bullish long-term bias, AXS would have to break above the $19 mark and retest the $18 as support. The buying volume would also have to pick up correspondingly, hence, an uptick in the A/D would need to be seen. Given the sentiment in the crypto market, such a turnaround looked doubtful at the time of writing.


