For Bitcoin and ‘fearful’ market participants, the only direction will be…

Disclaimer: The findings of the following analysis are the sole opinions of the writer and should not be considered investment advice
Every market is a huge tug-of-war game between fear and greed. The lines on a chart help simplify this game and help understand where the troops of each camp are concentrated, where their forts are strong, and where they are weak. Bitcoin is no different- and the emotions of fear and greed are hugely impacted by the goings-on in the global political and economic landscape. At the time of writing, Bitcoin was toiling under a bearish regime- but there were some early signs that this could change in the months to come. The hash rate continued to rise, a show of strength from the network and miners.
BTC- 1D
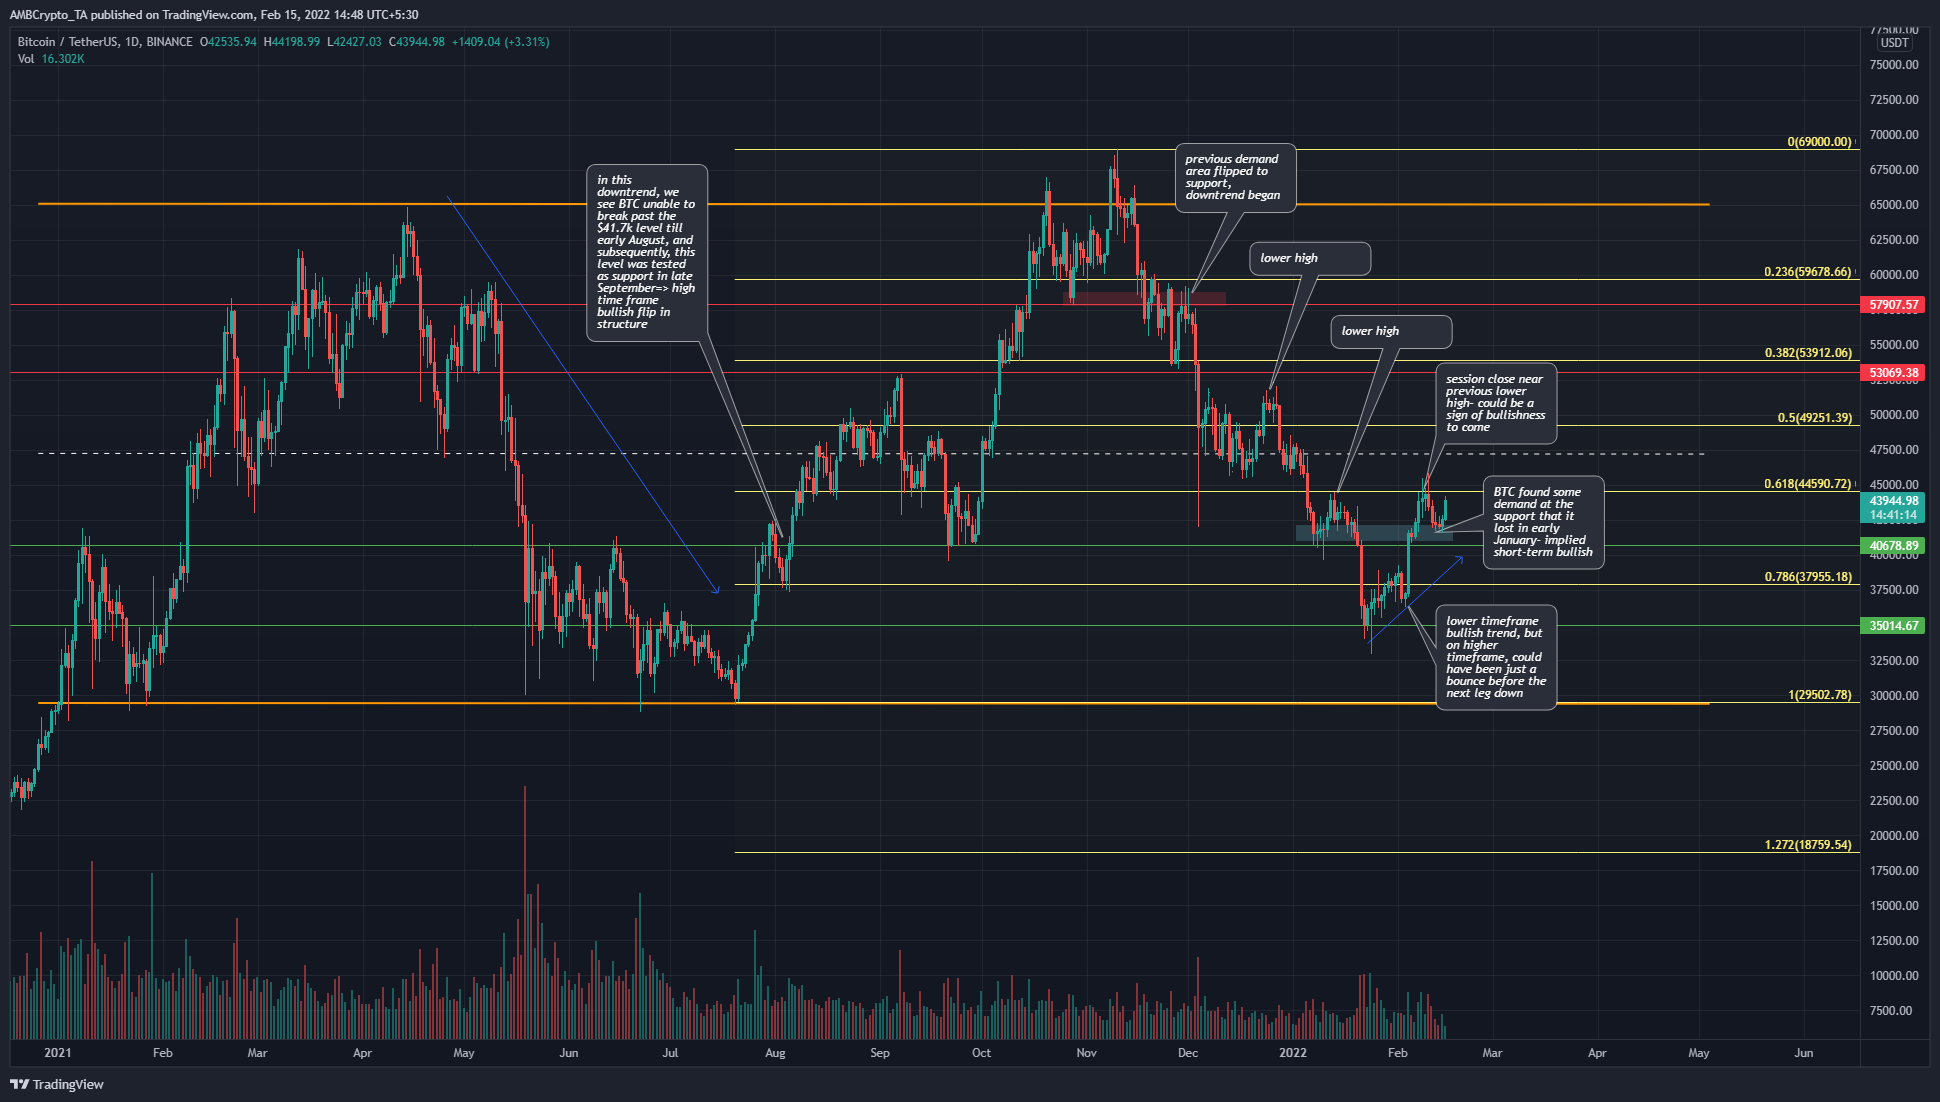
Since “Uptober”, that is, a bullish October, Bitcoin has been sliding down the charts. It has registered a series of lower highs, with the most recent one at the $44k area. In the past couple of weeks, Bitcoin has bounced from the $35k support level and was once more knocking on the doors of the previous lower high.
This could be a market structure shift beginning to form. It was not clear yet that the bulls did indeed have the upper hand.
There were plenty of areas of resistance for the price to overcome in the next few weeks. The most imminent one at $44.5k, then the mid-point at $47.5k of a year-long range (orange). Above these two levels was the $52k-$54k area.
BTC could be rejected from these areas on its first try to climb above, but so long as it can stay above $40k, the prospects of a move toward $46k, and possibly as high as $52k, were not too shabby.
Rationale
Outside of indicators, the fears in the market of rising inflation were seen as a sign that money would begin to flow out of crypto, as it is a risk-on asset. Yet macroeconomics lies outside of technical analysis. The charts showed us that bullish momentum was rising once more.
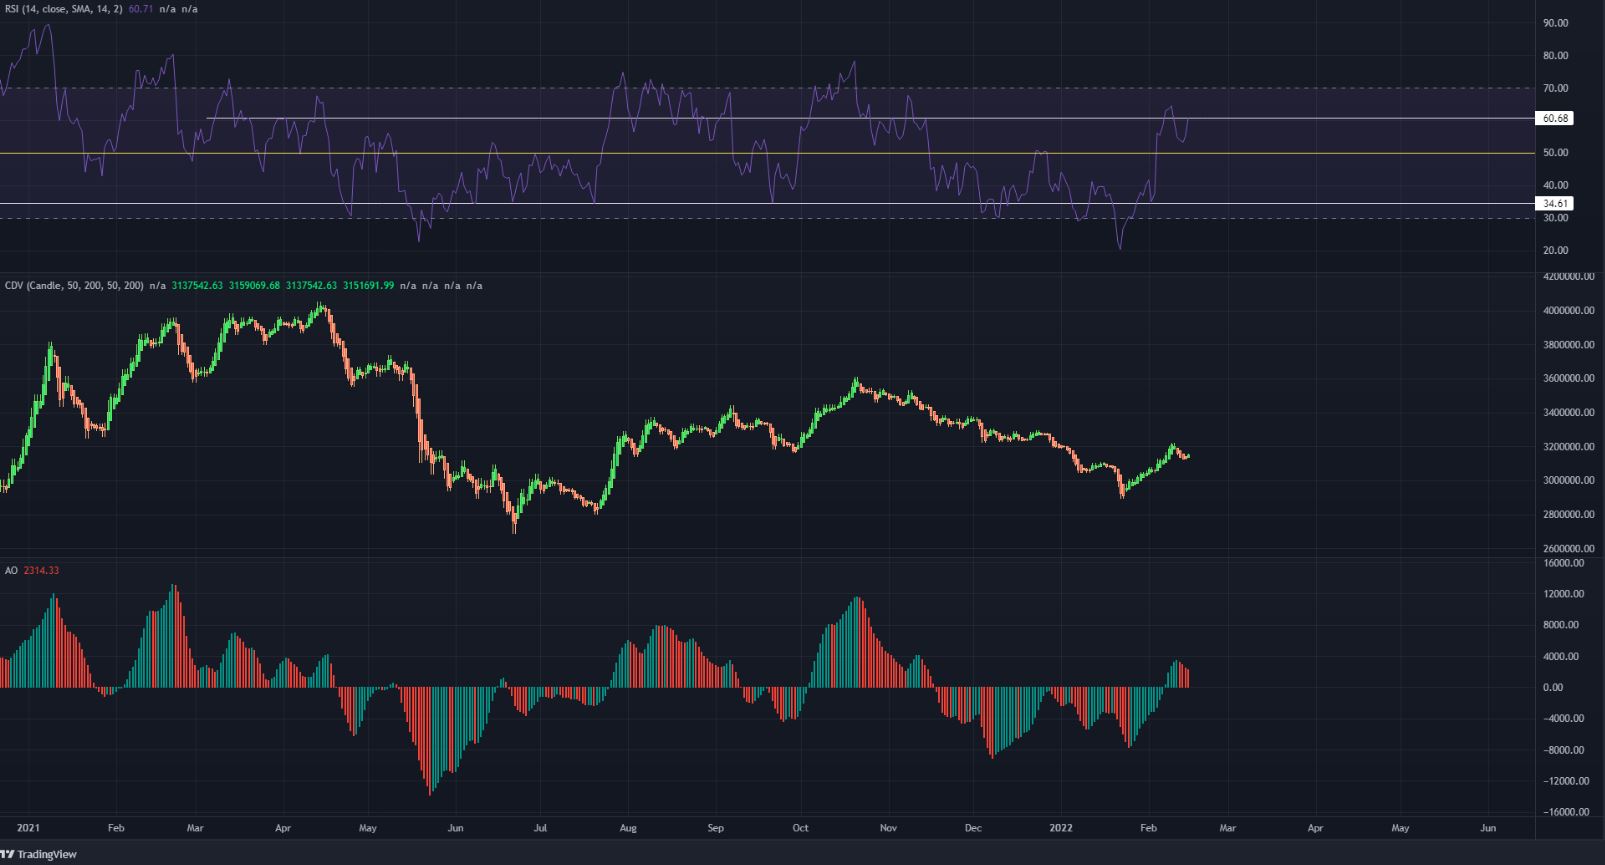
The daily RSI climbed above neutral 50 for the first time since November and was also near the 60 mark. A move above 60 on the daily RSI could be a sign of gains to come.
The CDV was not very encouraging- it showed some demand behind the rally of the past two weeks, but the buying volume was only a fraction of the selling volume on the way down since late October.
The Awesome Oscillator also climbed above the zero line after weeks spent in bearish territory.
Conclusion
The indicators showed that bearish strength had weakened, while BTC also tried hard to climb past the $44.5k level. For long-term investors, a candle close above $54k would be needed before a strong move upwards can occur once more – and this move could have its highs near the $75k mark. To the downside, a session close below $40k could see Bitcoin drop hard towards $30k.