For Solana, the determining factors for an extended rally are…

Solana (SOL) coin experienced a notable rally following the bullish resurgence at the $96-mark. The buyers have been pushing for an advantage after multiple attempts to puncture through the EMA ribbons over the last few days.
Whether the bulls have enough thrust to sustain a rally beyond the bonds of the ribbons is a question worth pursuing. At press time, SOL was trading at $103.65, up by 5.35% in the last 24 hours.
SOL 4-hour Chart
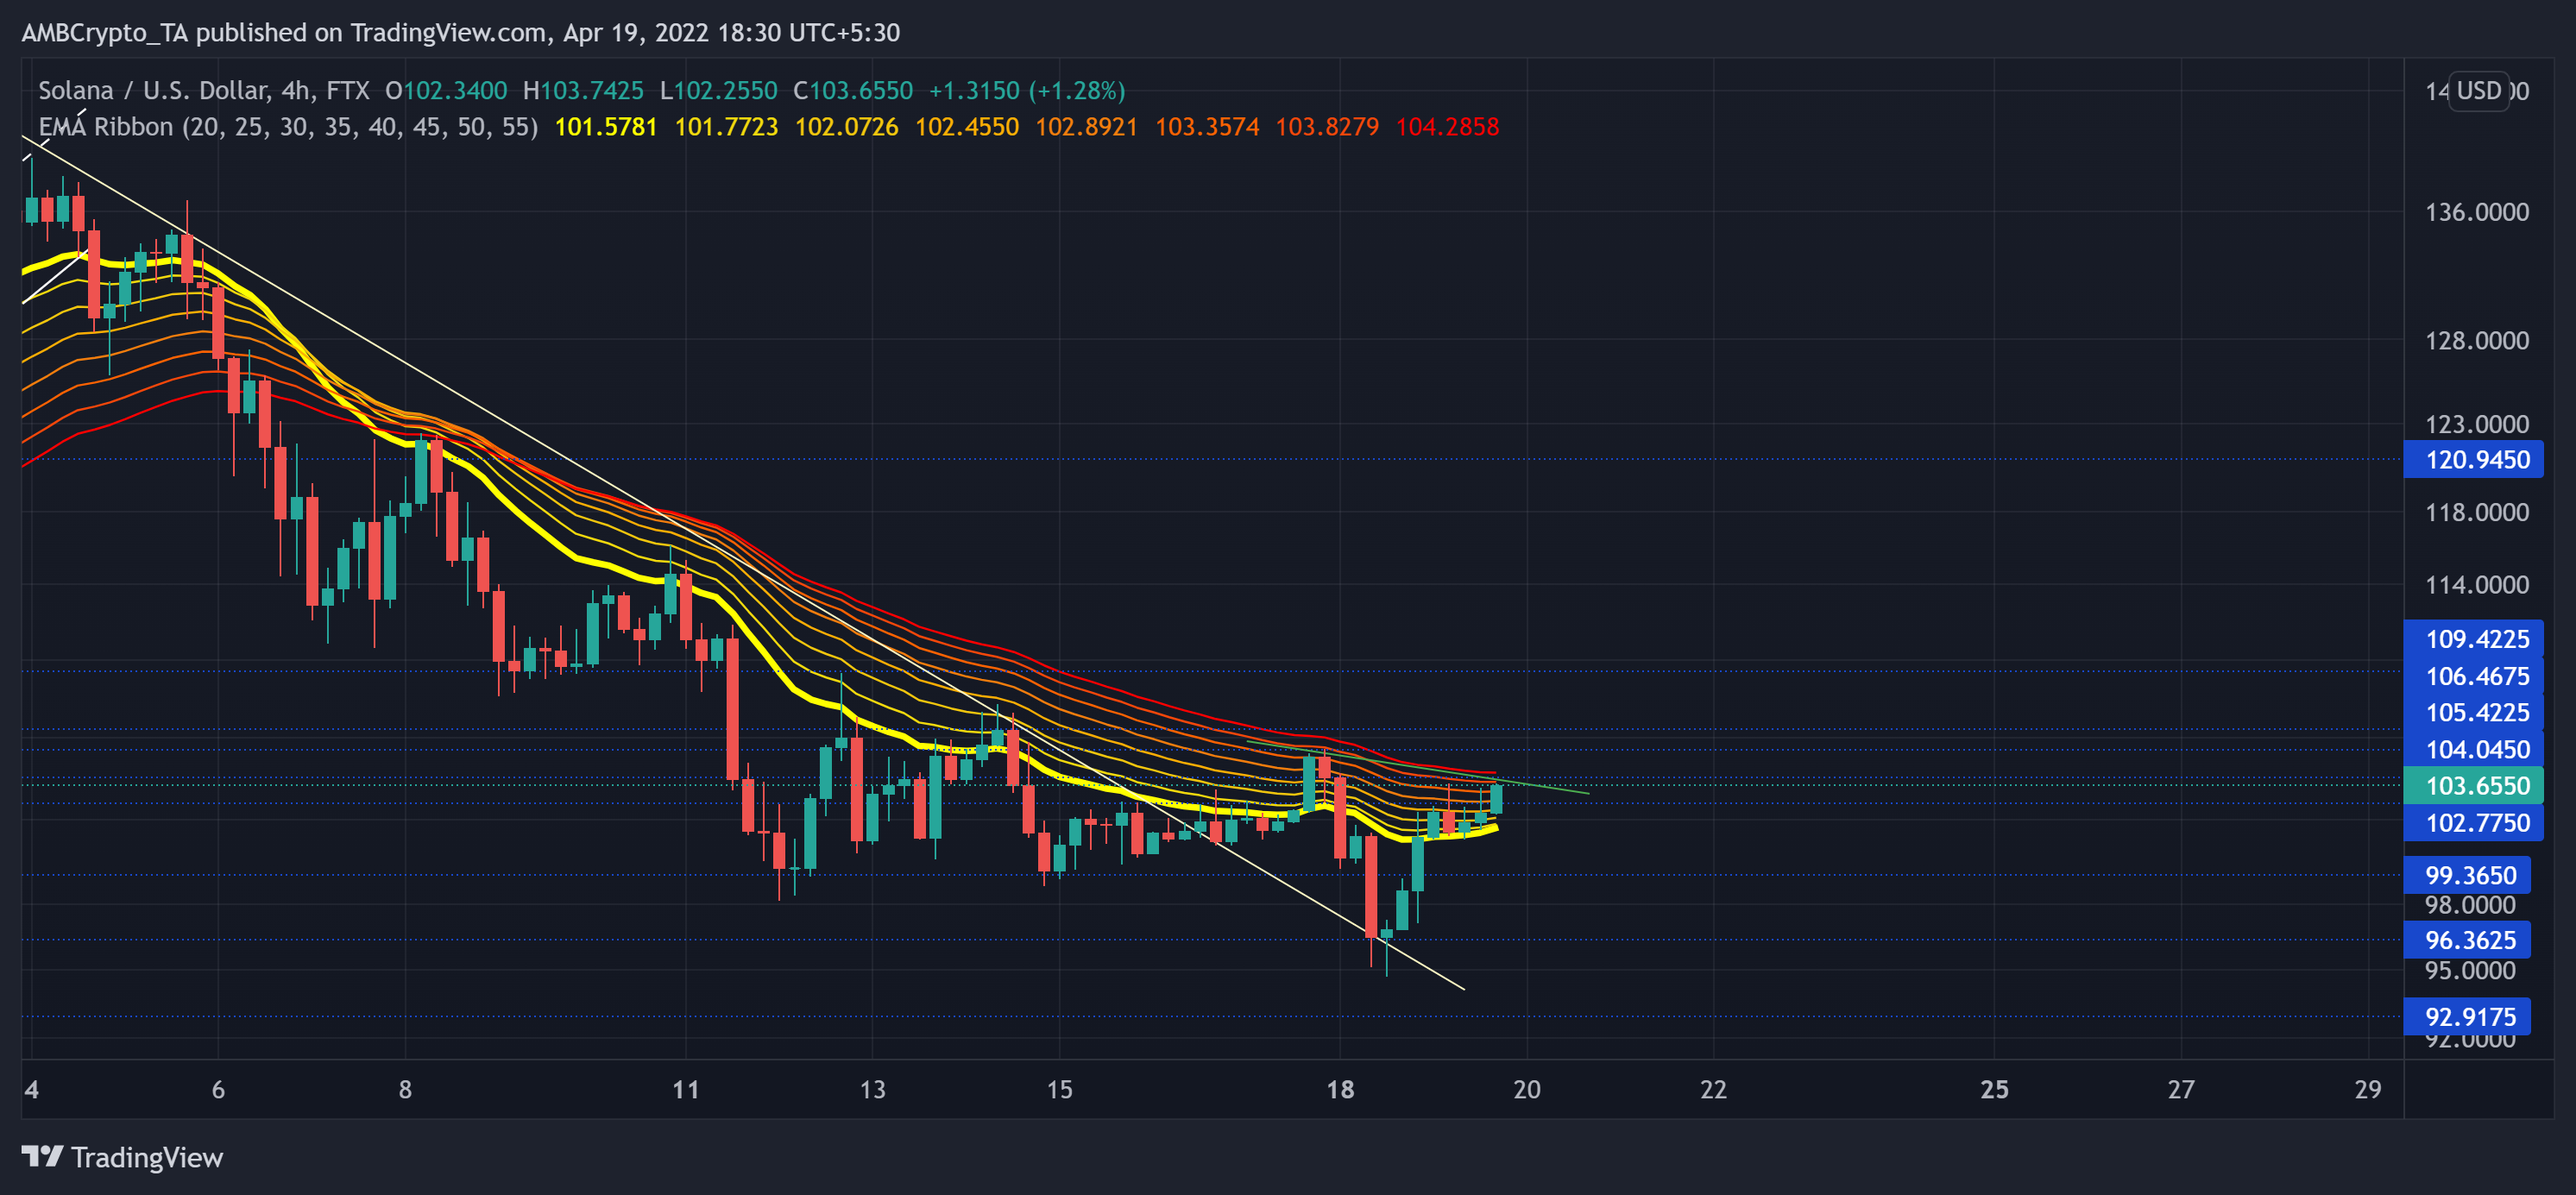
SOL’s up-channel breakout on 4 April made way for a vigorous bear run that has accounted for a 33.8% decrease from the breakout point of $132 to its three-week low on 18 April at the $94-level.
Following the recent Bitcoin jump, SOL displayed a similar growth on its charts over the past day. With bulls initiating a near-term buying spree, the alt found itself on a pathway to test the 55 EMA. As a result, the gap between the ribbons seemed to improve in favor of buyers. But the $103-$104 range could pose some hefty barriers in the ongoing rally.
With an over 9% drop in the trading volumes over the last day, the current gains seemed fragile and susceptible to bearish interventions. Nevertheless, a close above the ribbons would position SOL for a test of the $105-zone before possibly facing slight resistance. On the flip side, any reversals from the $104-mark could cause a further pullback in the coming days.
Rationale

The alt’s Relative Strength Index kept the bullish revival hopes alive as it still looked north following its breach of the midline mark. A continued trajectory above the 57-mark would open up a recovery route for SOL towards the $105-$107 range. Also, the CMF swayed above the zero-mark and corresponded with the RSI’s bullish stance.
The OBV’s movements saw improvements, a close below its immediate trendline resistance would affirm a hidden bearish divergence with the price on the 4-hour timeframe.
Conclusion
The investors/traders should watch for a close above the EMA ribbons at the $104-mark. In which case, SOL could see an extended recovery towards the $106-zone before a plunge on its charts. However, it is vital to take note of the decreasing volumes and, with it, the higher chances of a failure to maintain its current bull run.
Besides, considering the impact of the broader sentiment of Bitcoin’s movement would also be vital in making a profitable move.


