
- Bitcoin’s price has declined by nearly 5% in the last seven days.
- Most metrics and market indicators hinted at a continued price decline.
Bitcoin [BTC] bulls have been struggling to take control of the market as the king of cryptos’ weekly chart continued to remain red.
However, BTC might have a trick up its sleeve. If the latest data is to be considered, then BTC was silently moving inside a bullish pattern, which could push it to new highs.
Bitcoin targets $127k
CoinMarketCap’s data revealed that BTC’s price had declined by nearly 5% in the last seven days. At the time of writing, BTC was trading under $67k at $66,147.26 with a market capitalization of over $1.3 trillion.
Meanwhile, Gert van Lagen, a popular crypto analyst, posted a tweet highlighting an interesting development.
As per the tweet, the recent price drop might be because BTC was consolidating inside a bullish flag pattern.
The tweet also mentioned that BTC had successfully tested the support. If that’s true, then BTC might soon initiate a bull rally, which might result in BTC touching $127k in the coming weeks or months.
BTC’s next move
Since the possibility of BTC touching $127k anytime soon seemed to be a long shot, AMBCrypto then assessed the king of cryptos’ metrics to find out what to expect in the short term.
Our analysis of Glassnode’s data revealed that BTC’s NVT ratio spiked sharply. A rise in the metric means that an asset is overvalued, indicating a possible price decline in the coming days.
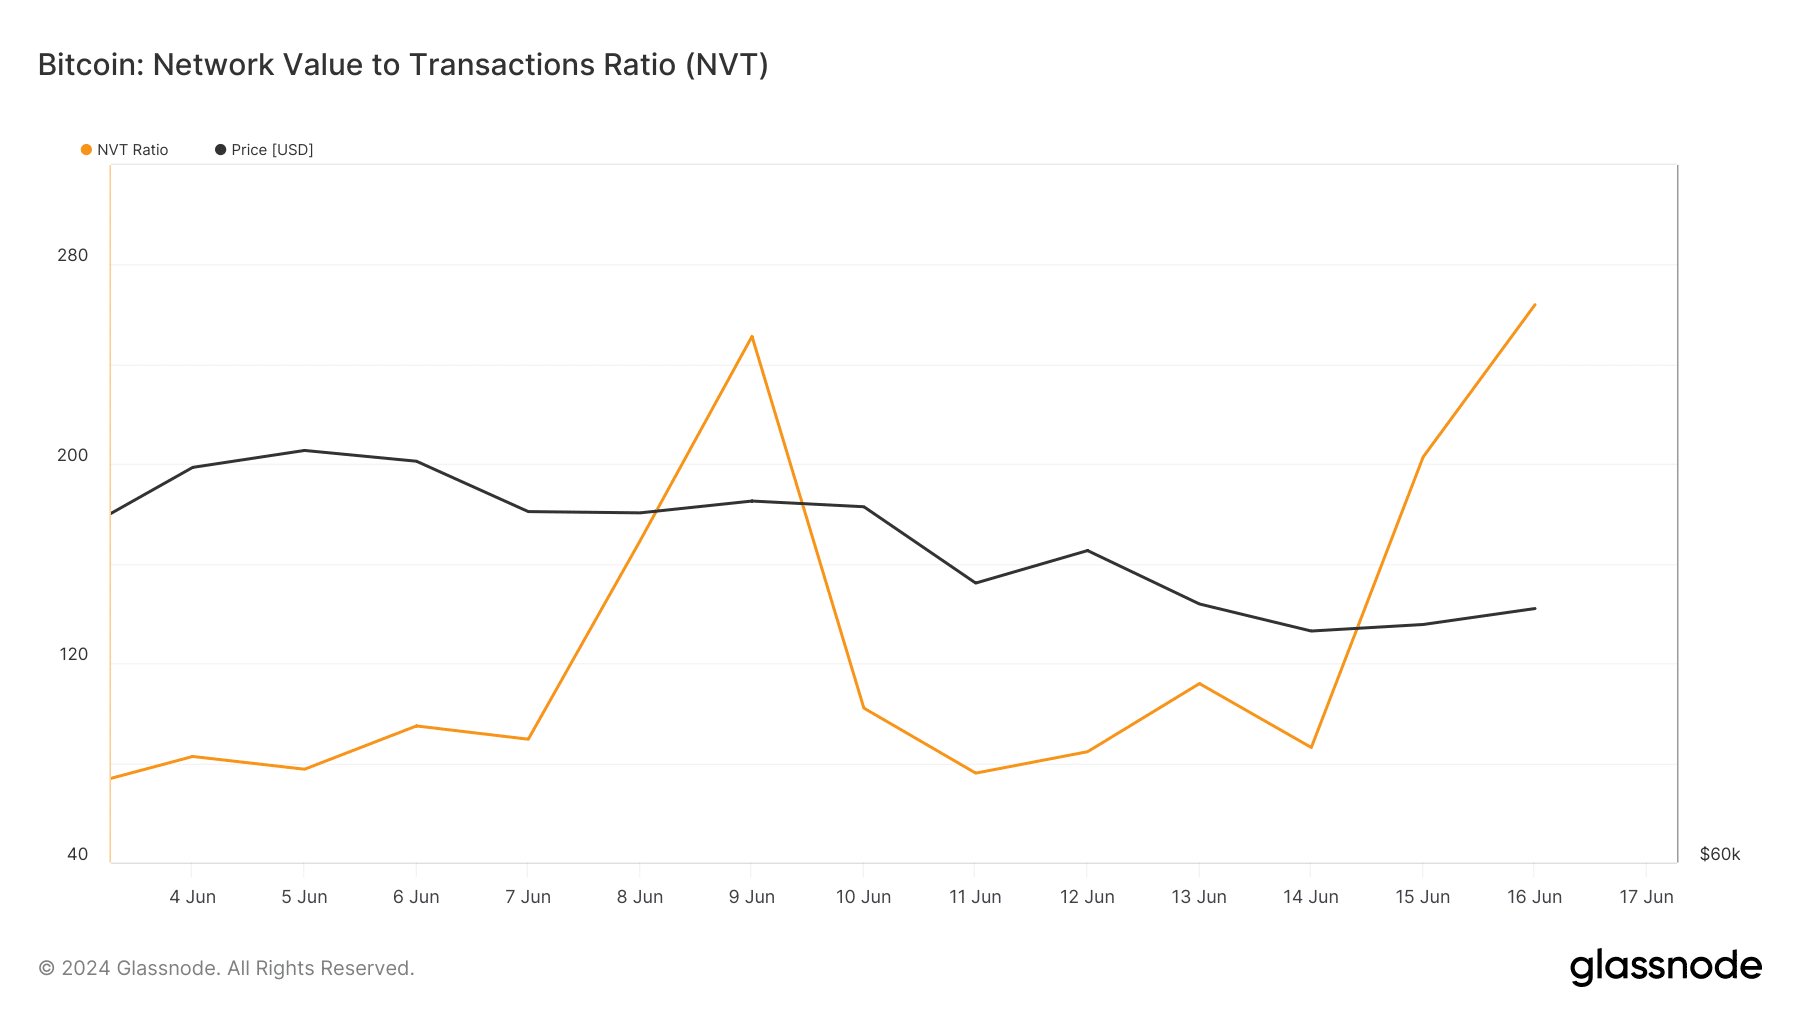
Source: Glassnode
We then took a look at CryptoQuant’s data. We found that BTC’s net deposit on exchanges was higher compared to the last seven days’ average, meaning that selling pressure on BTC was high.
BTC’s aSORP was red. This means that more investors are selling at a profit. In the middle of a bull market, it can indicate a market top.
Nonetheless, things in the derivatives market looked positive as its taker buy/sell ratio indicated that buying sentiment was dominant among futures investors.

Source: CryptoQuant
However, market indicators continued to remain bearish on the coin. For instance, both BTC’s Relative Strength Index (RSI) and Chaikin Money Flow (CMF) registered downticks and were resting under their respective neutral marks.
The MACD displayed a bearish advantage in the market, hinting at a continued price decline.
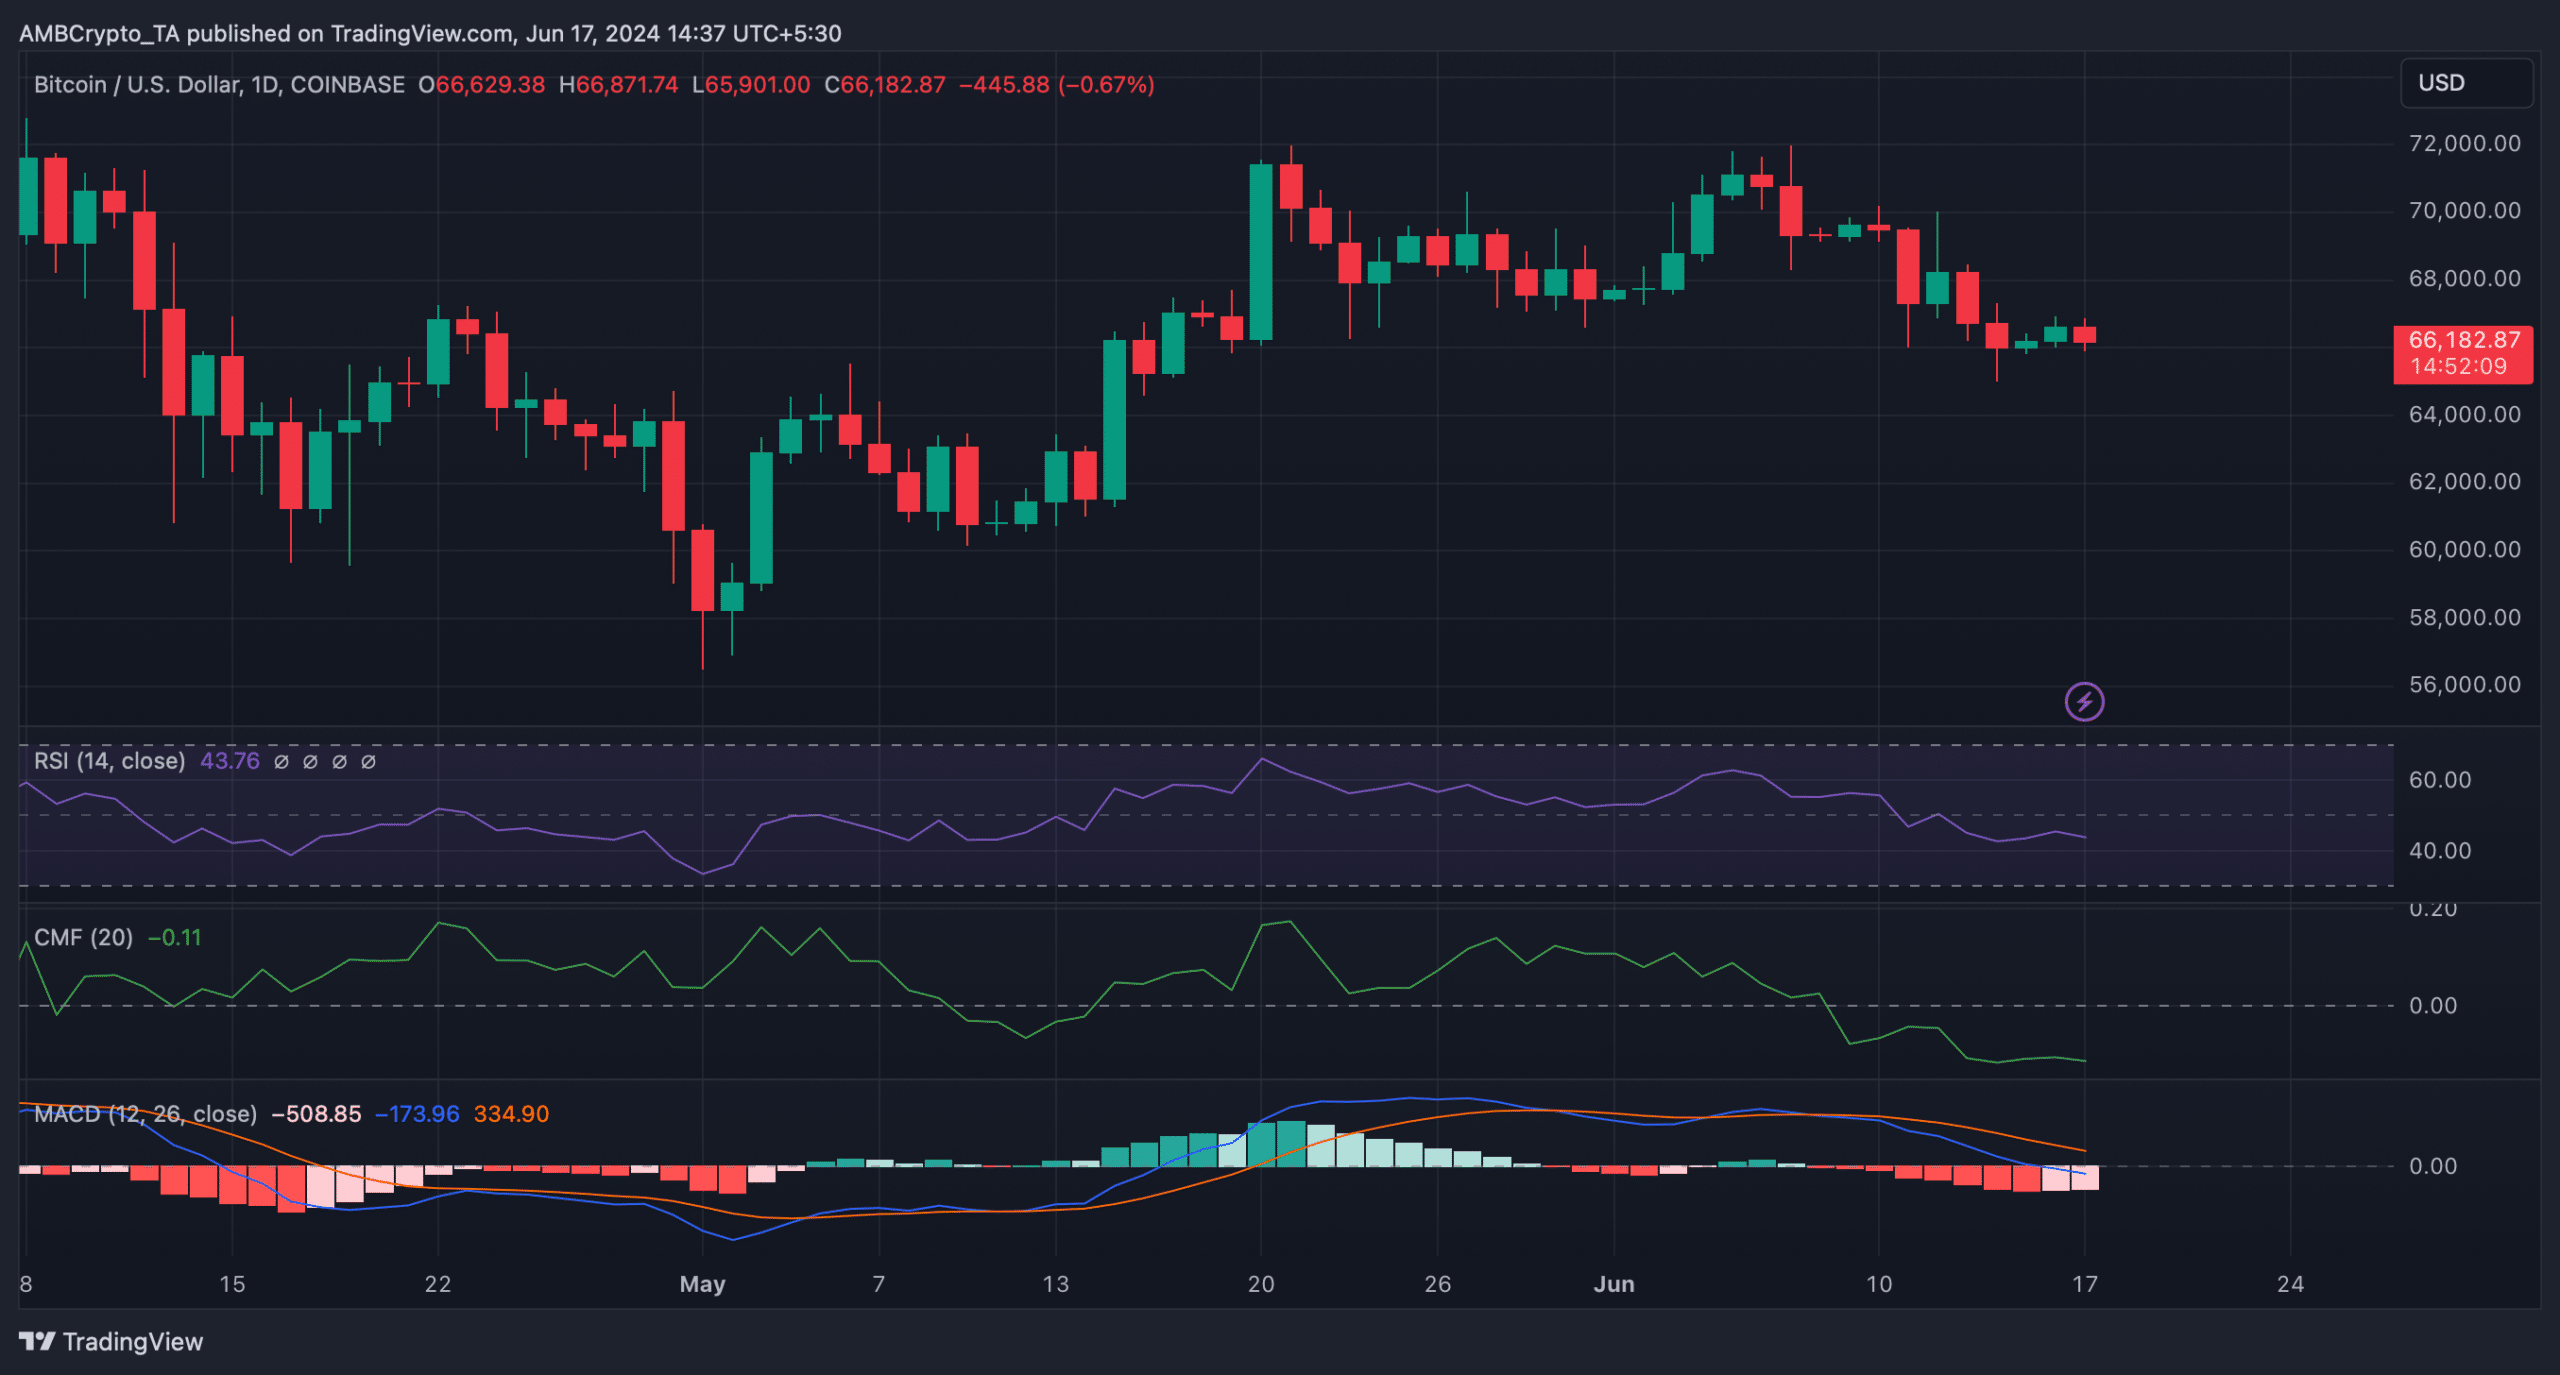
Source: TradingView
Read Bitcoin’s [BTC] Price Prediction 2024-25
AMBCrypto’s analysis of Hyblock Capital’s data revealed that if BTC remains bearish, then investors might witness BTC touching $65k this week.
A plummet under that level might result in BTC dropping to $60k in the coming days. To the contrary, if BTC turns bullish, then it might first reach $67.65k.

Source: Hyblock Capital