FTX Token, EOS, AAVE Price Analysis: 19 May

Post the market-wide plummet, the altcoin market has been struggling to keep up with the rejection of higher prices. As a result, AAVE saw an anticipated bearish rising wedge breakout from its EMA ribbons.
Similarly, FTX Token and EOS broke out of their pennants to display a near-term bearish edge. To flip the existent fear sentiment, the bulls still needed to break the low volatility compression phase by injecting heightened buying volumes.
FTX Token (FTT)
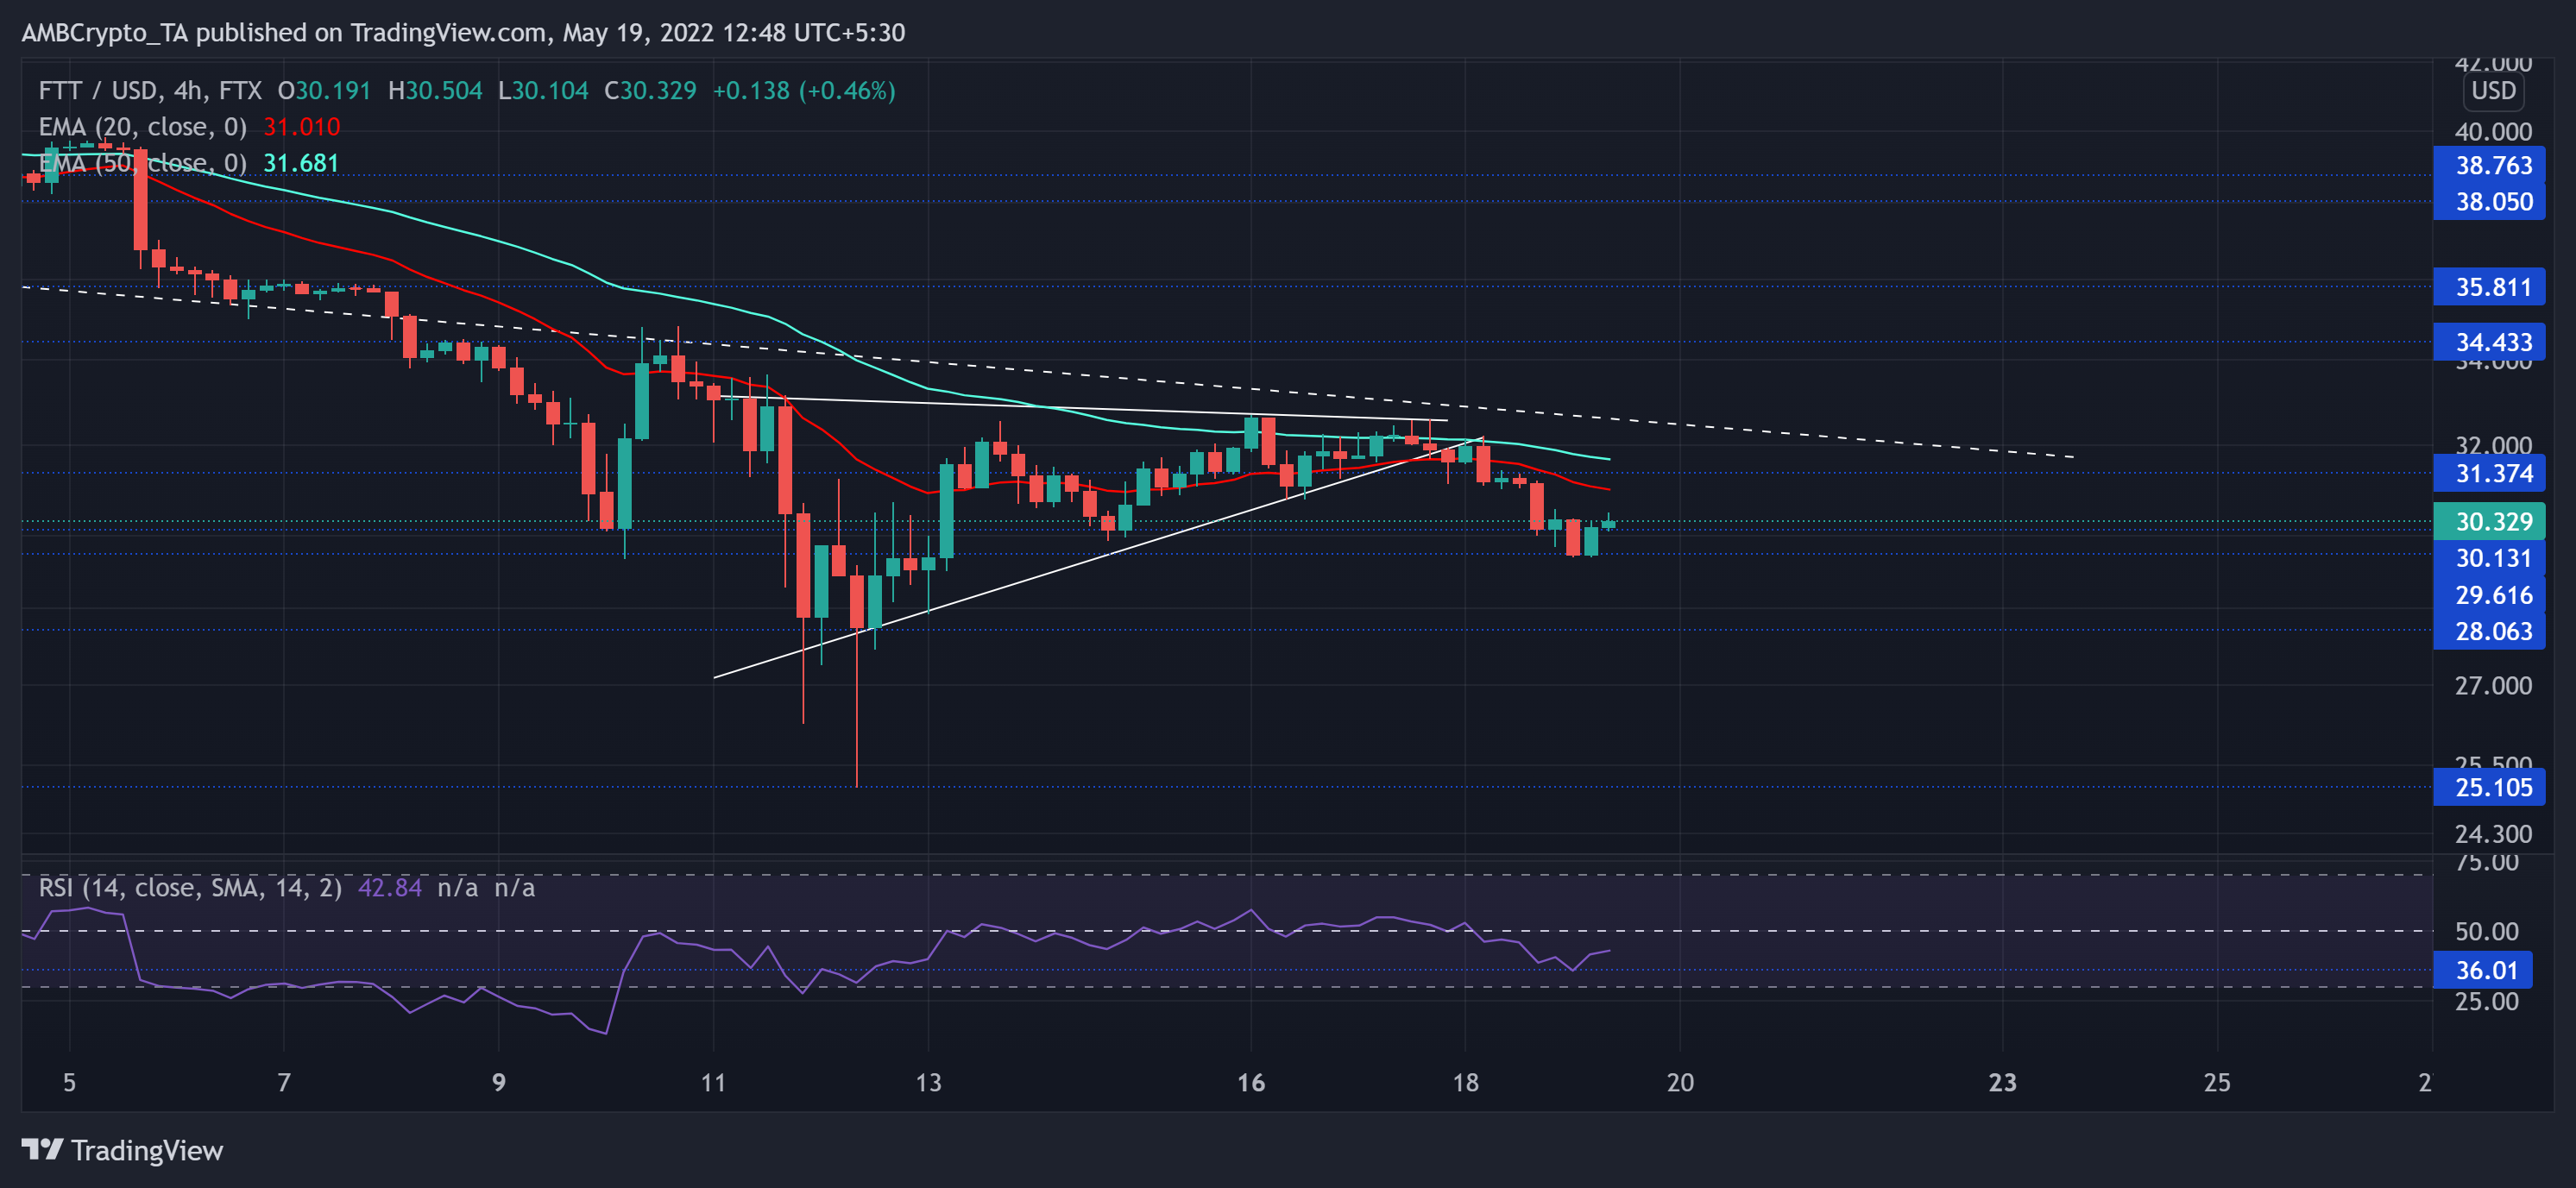
The determined bearish efforts over the last 50 days have transpired into a rush of sell-offs. After a staggering 50.73% selling spree from its April highs, FTT took a solid plunge toward its nine-month low on 12 May.
With the $28-baseline offering some chances for the bulls to recoup, the bullish resurgence in a pennant halted at the two-month trendline support and turned into resistance. After an expected bearish breakout, 20 EMA (red) refrained from undertaking a bullish crossover with the 50 EMA (cyan).
At press time, FTT traded at $30.12, down by 4.07% in the last 24 hours. After escaping from the bounds of its squeeze phase, the RSI dropped to exhibit a slight bearish edge. With the 36-mark supporting the recent fall, the bulls still needed to find a spot above the equilibrium to propel a strong rally on the chart.
EOS
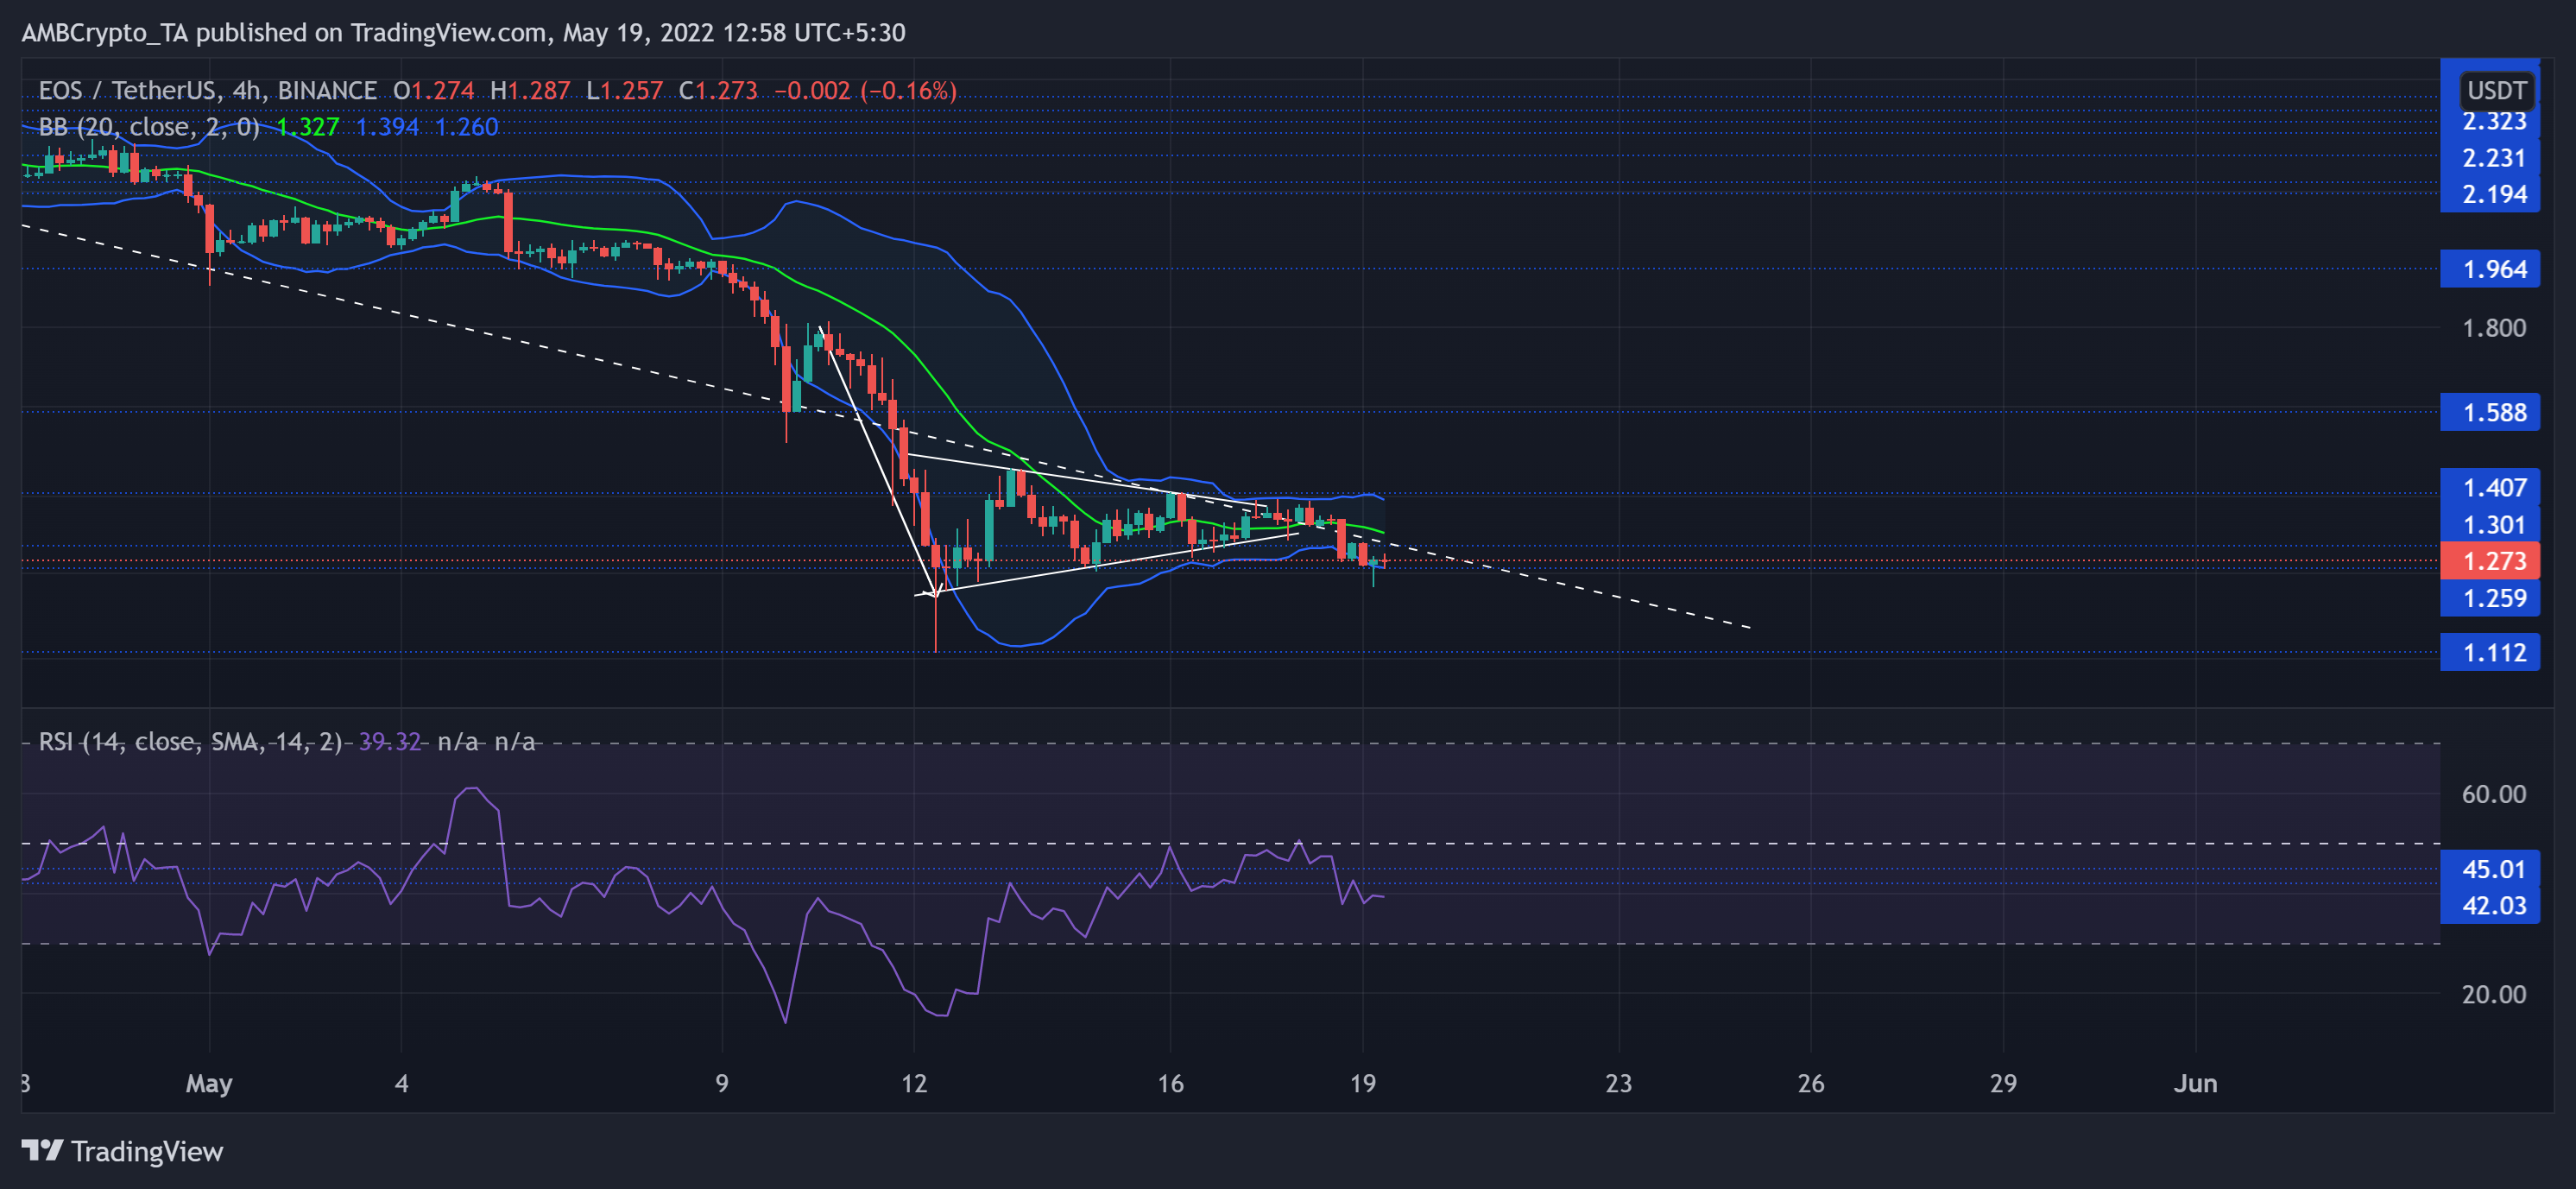
Similar to FTT, EOS marked a similar trajectory on its chart. The altcoin saw a decline of about 61% (from its April highs) to see itself gravitating toward its multi-yearly low on 12 May. While the $1.2-mark propelled a strong rejection of lower prices, EOS marked a bearish pennant on the four-hour timeframe. As the three-week trendline resistance posed an expected obstruction, the alt fell back toward the lower band of Bollinger Bands.
At press time, EOS traded at $1.273. The slightly bearish RSI is unable to break above its equilibrium for the last two weeks now. After losing the 42-45 range, the sellers revealed their superior edge in the current scenario.
AAVE

After being rangebound for over four months in the $112-$245-zone, the sellers found renewed pressure to pierce through the 13-month baseline at $112. As a result, AAVE registered an over 76% correction in this bear run from its April highs.
In the devaluation phase, the EMA ribbons have visibly constricted most buying rallies while keeping the sellers in the driving seat. The recent bearish rising wedge breakdown reiterated the selling edge in the market.
At press time, AAVE traded at $84.21. Finally, the CMF was yet to find a close beyond the zero-mark to establish a favorable change in momentum.