Gala investors anticipating profit should know this level is crucial for them

Disclaimer: The findings of the following analysis are the sole opinions of the writer and should not be considered investment advice
Over the past few days, Bitcoin faced rejection near the $45.2k mark and has steadily slid since then to trade at $39.1k at the time of writing. Gala too had pushed up toward $0.275 but faced rejection at that level. Interestingly, this was the same level that marked one of the lower highs for Gala on its downtrend in the second and third week of February. Was more downside in store?
GALA- 1H
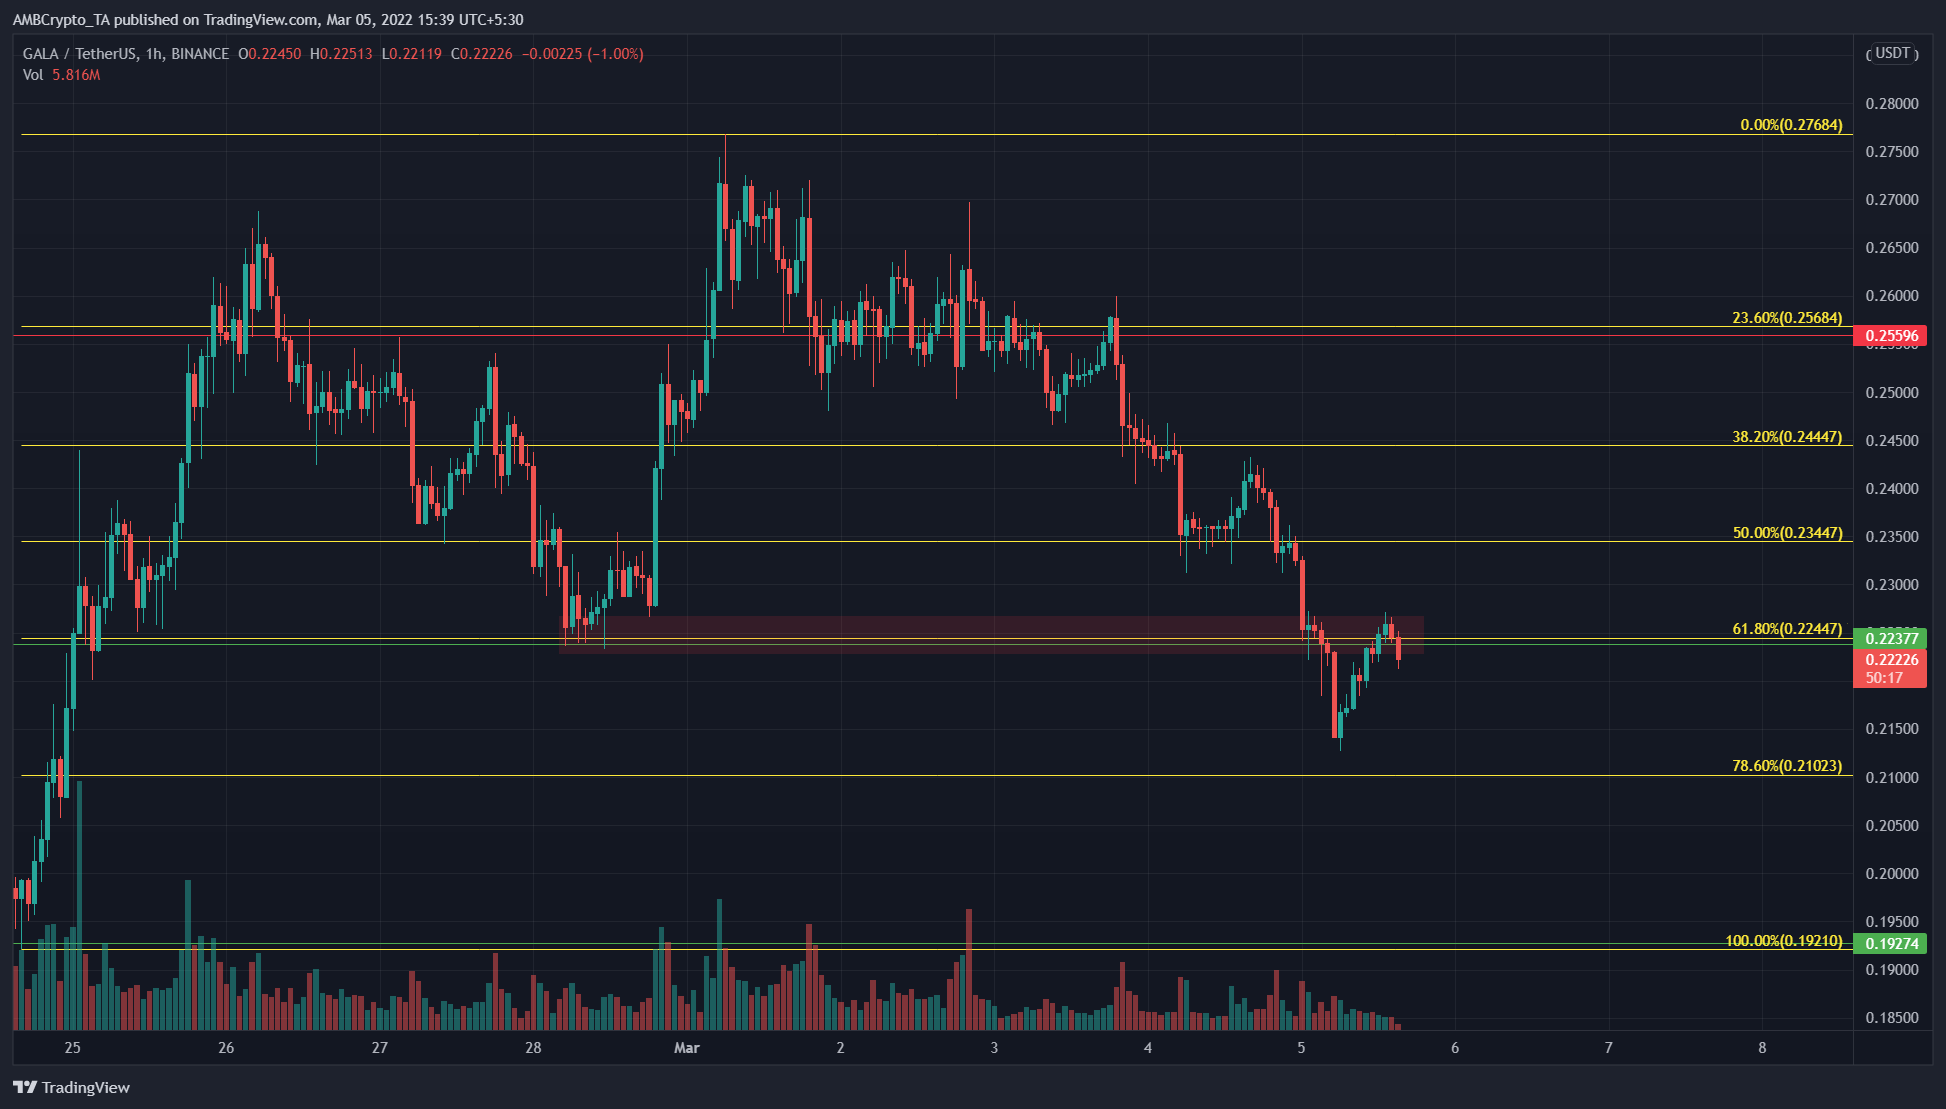
On the charts, the past week saw GALA climb from the $0.192 lows to $0.26 before pulling back to the $0.224 area in search of demand. It appeared that early in March, GALA had continued on its bullish market structure and pushed past $0.27, but the $0.275 highs rejected the advance of the bulls.
A set of Fibonacci retracement levels (yellow) were drawn based on the move from $0.192 to $0.276. The $0.224 and $0.21 levels were shown to be the 61.8% and 78.6% retracement levels of this move.
Therefore, while we can expect some demand and temporary relief in these areas, further downside could be likely. The $0.224 level, which had acted as demand a few days ago, was flipped to supply in recent hours.
Rationale
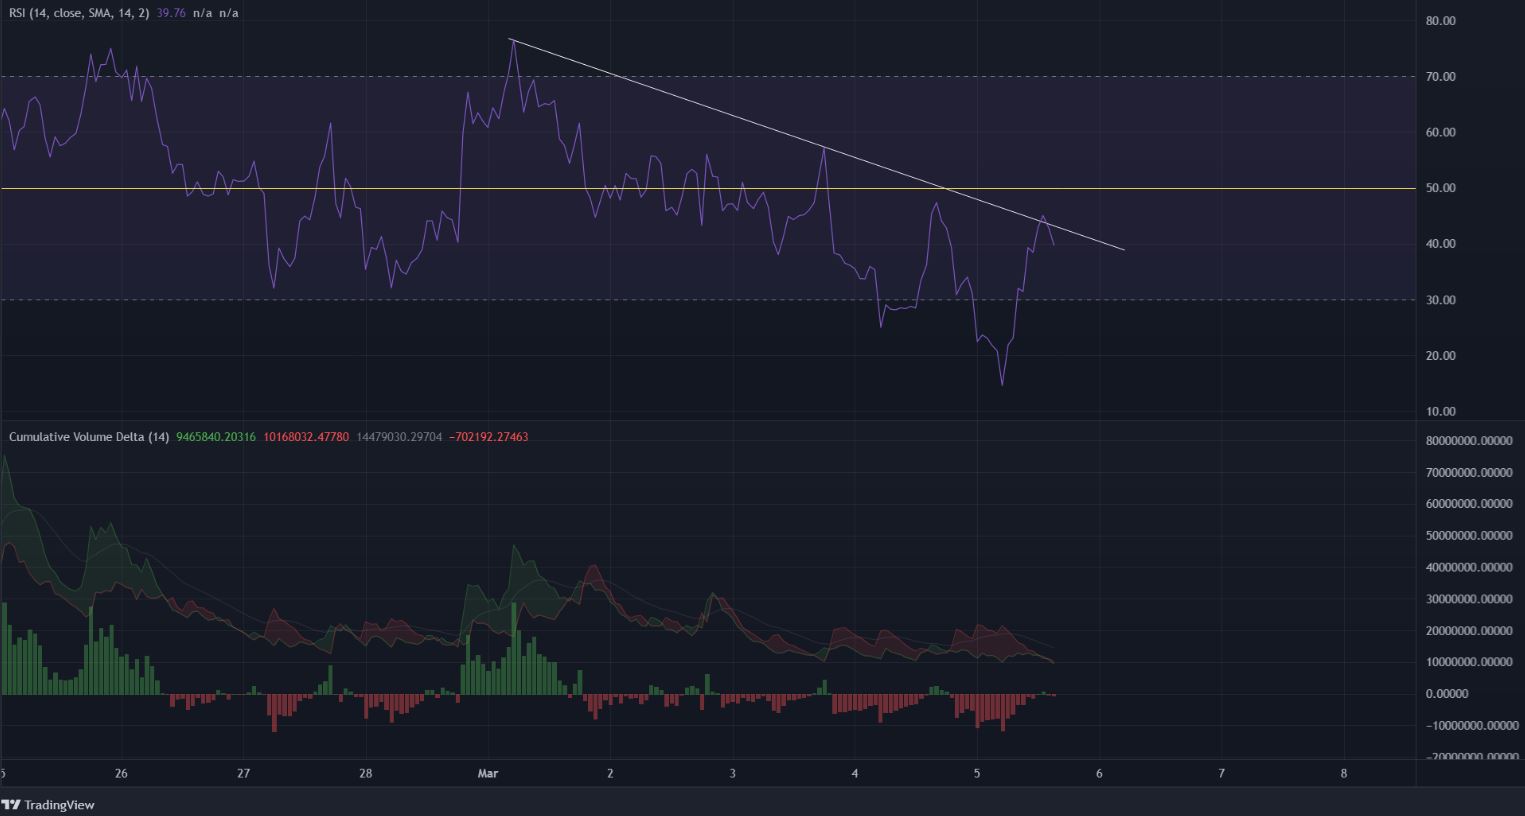
The RSI has been unable to break above a short-term descending trendline (white) and stood at 39.9, which showed bearish momentum was strong once more.
The CVD showed that the past few days had seen steady selling volume which meant that the downtrend had legs to stand on. A further downside could be seen for GALA, especially if Bitcoin fails to hold on to the $38k-$39k area.
Conclusion
The charts showed that further downside was likely for GALA now that $0.24 was flipped to resistance. To the south, demand could arrive at the $0.21 and $0.192 levels. The near-term market structure was flipped to bearish when $0.256 was flipped to resistance, hence the short-term outlook remained bearish.


