Gauging how NEAR’s efforts to break above $6 might go

NEAR’s consistent devaluation over the last seven weeks pulled the alt to find fresher multi-monthly lows on its chart. While the bulls finally provoked a down-channel breakout, NEAR clawed back above the 23.6% level.
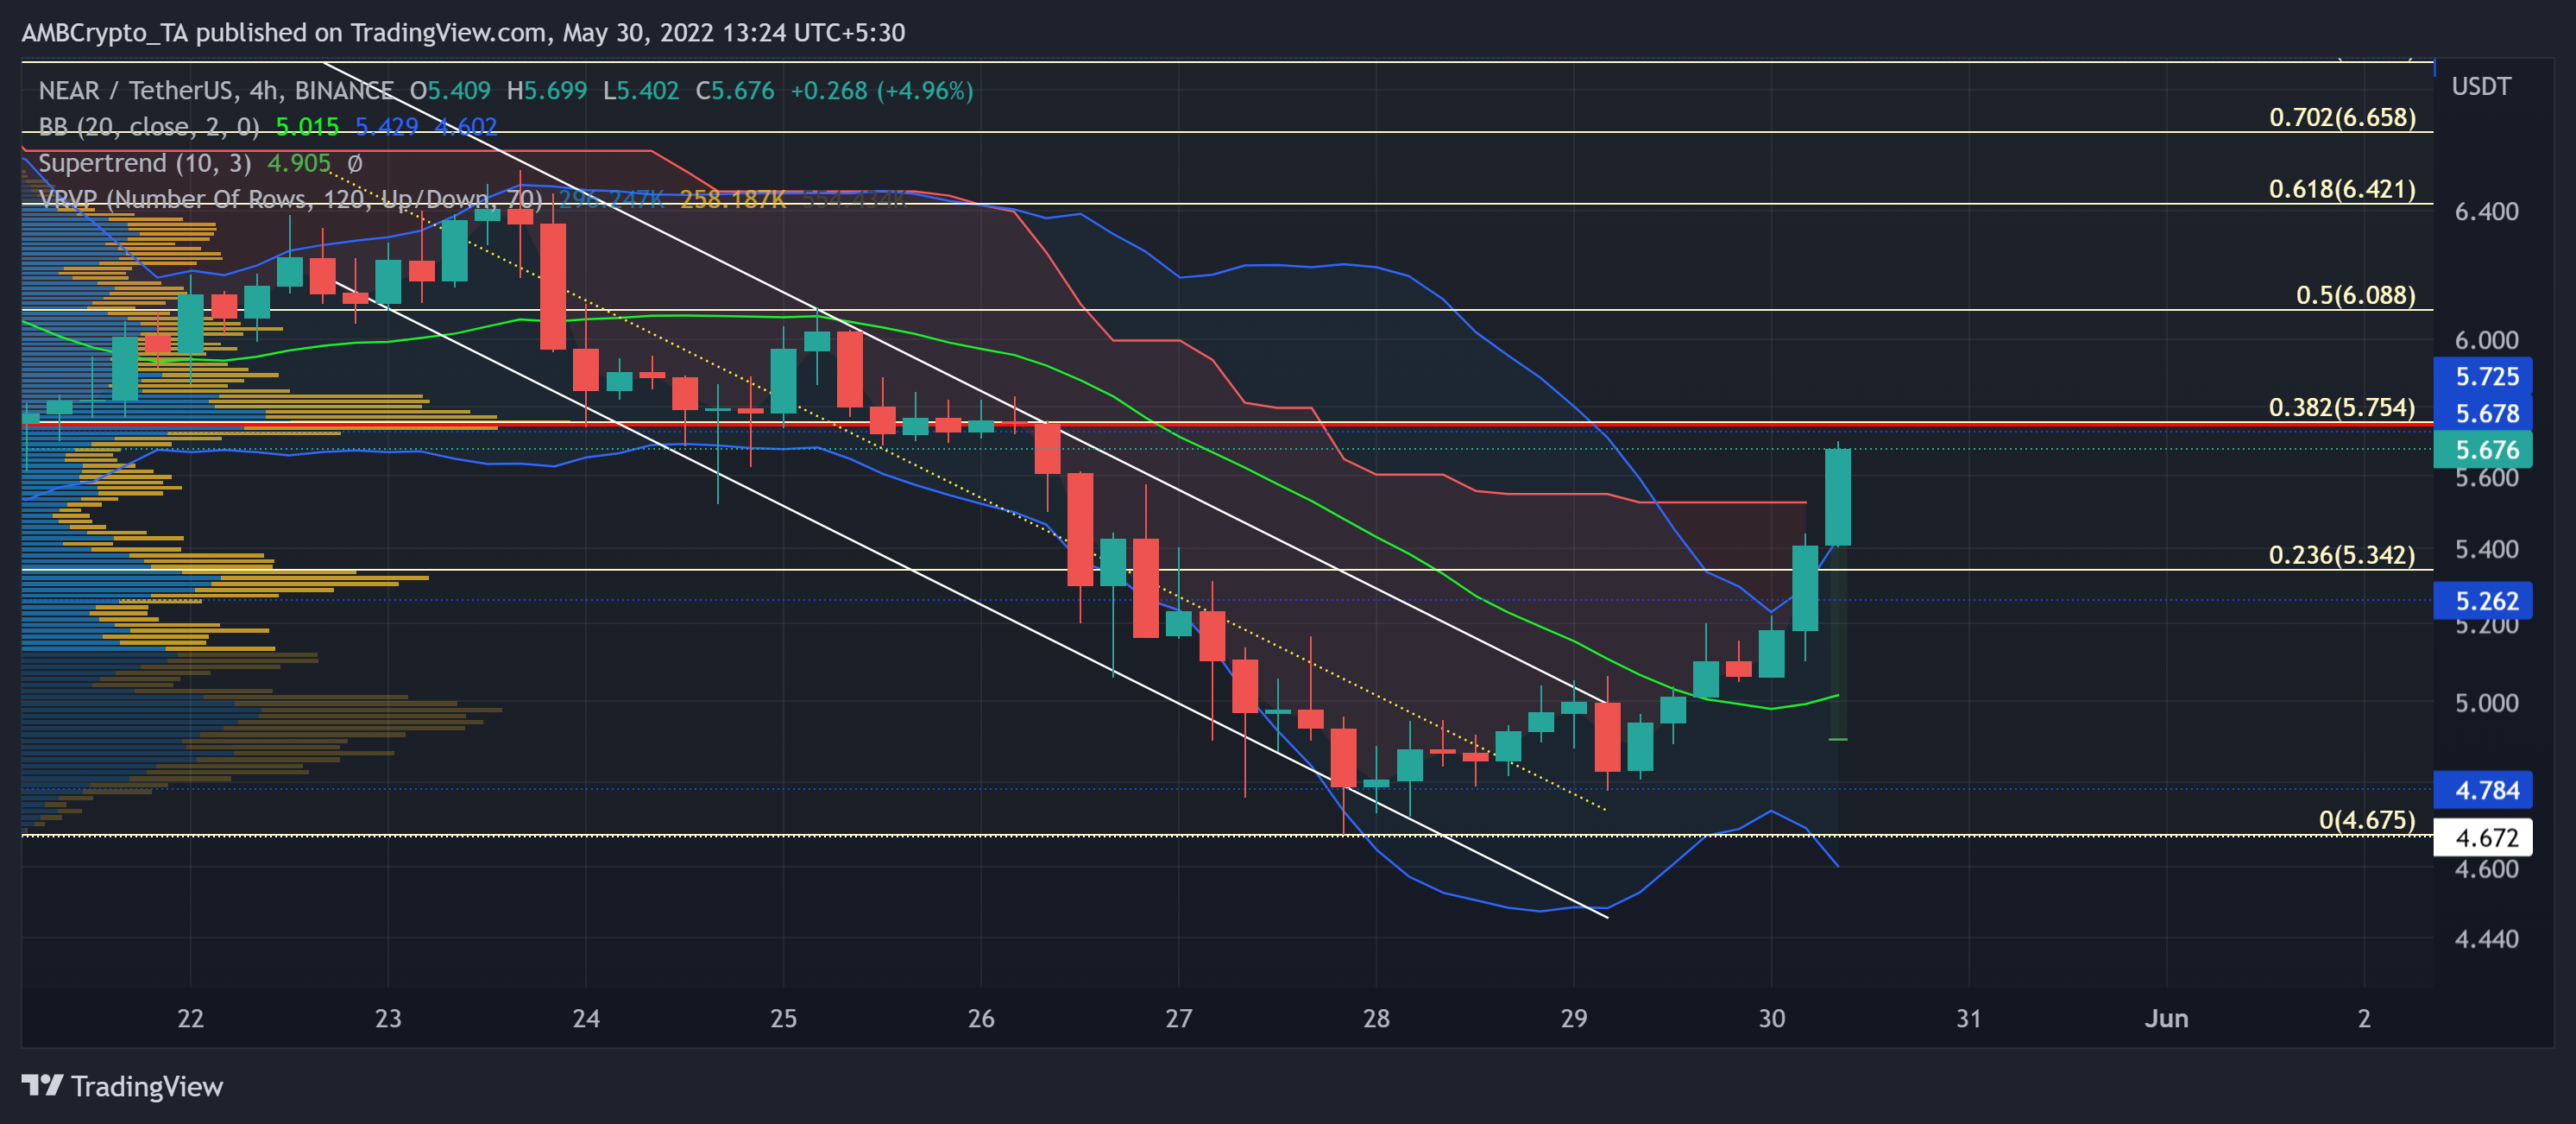
With an uptick in the buying pressure, a continued revival could see a testing phase in the $5.7-region. At press time, NEAR traded at $5.676, up by 14.38% in the last 24 hours.
NEAR 4-hour Chart
After the narrative for NEAR visibly skewed in favor of bears post the market-wide liquidations, the buyers stepped in to take charge of the near-term peaks.
NEAR lost nearly 60% of its value from 9 May and lunged toward its nine-month low on 27 May. The previous reversal from the 61.8% Fibonacci resistance kept the alt below the basis line (green) of the Bollinger Bands (BB) until the recent breakout.
The double-digit 24-hours gains alongside a spike in buying volumes gave NEAR enough thrust to now test the 38.2% Fibonacci level. With the upper band of the BB looking north, the alt could see an extended high volatile phase in the coming sessions.
An eventual slowdown at the Point of Control (POC, red) could lead NEAR into a short-term tight phase. Also, the Supertrend affirmed this increase in buying pressure as it changed its stance to exhibit a bullish inclination.
Rationale
The bullish Relative Strength Index (RSI) saw a swift growth in the past day from its 44-baseline. An eventual break beyond the 65-level would position the index to test the overbought mark in the coming times.
The OBV however failed to mark higher peaks over the last three days. Any reversal from its immediate resistance could affirm a rather ‘weak’ bearish divergence with price.
The DMI lines undertook a bullish crossover after the north-looking tendency of the +DI. This reading could justify near-term bullish movements on the chart.
Conclusion
All in all, the technical indications favored the buyers. NEAR could now test the 38.2% level near its POC. Should the buying volumes continue to see an uptick, the bull would aim to topple the immediate barrier and enter the $6-zone.
However, any breaks in the OBV’s trajectory could lead to a delayed recovery.
At last, the investors/traders must keep a close on Bitcoin’s movement affecting the market dynamics to make a profitable move.


