Global dApp industry marches on despite headwinds in Q2 2023
Global dApps tracking platform DappRadar published a report recently, revealing fascinating insights into the evolution of the dApp landscape in the second quarter of 2023.

- Q2 saw nearly an 8% increase in the daily Unique Active wallets from the previous quarter.
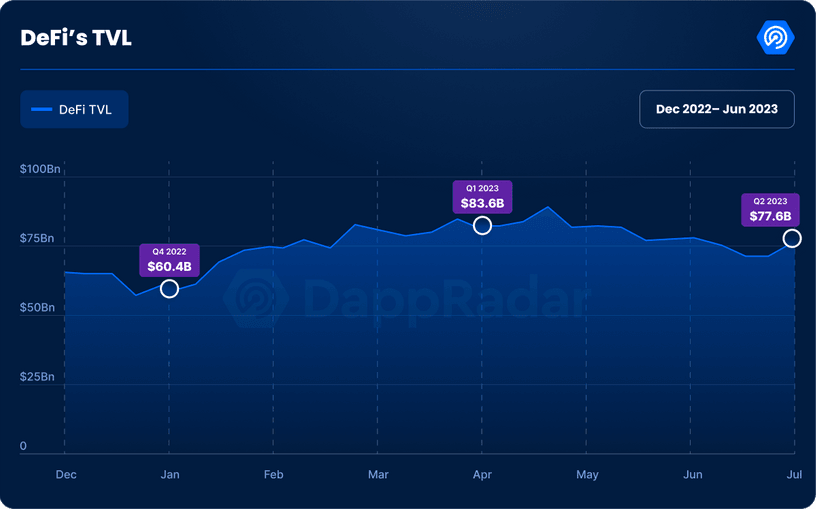
- TVL in the smart contracts of various DeFi applications fell 7%.
As the Web3 ecosystem continues to grow and evolve, the role of decentralized applications (dApps) has become increasingly crucial. Enthusiasts have been striving to develop disruptive dApps that serve to increase the potential of the decentralized web.
dApps, for the uninitiated, are software programs that run on a blockchain and are outside the control of a single dominant authority. The idea behind their development is to address pressing issues connected with Web2 applications in the current era, such as protection of user privacy and censorship.
As a result, the rise of dApps is tightly linked to Web3 adoption and is actively monitored by industry analysts.
State of dApps in Q2 2023
Global dApps tracking platform DappRadar published a report recently, revealing fascinating insights into the evolution of the dApp landscape in the second quarter of 2023.
The biggest highlight was the nearly 8% increase in the daily Unique Active wallets (dUAW) from the previous quarter. UAWs interact or perform a transaction with a dApp’s smart contract and are thus an important measure of the latter’s growth.
The growth in engagement underlined the resilience and recovery of the market, which grappled regulatory hostilities for the most part of Q2.

The gaming industry retained its position as the most dominant vertical in the dApp industry, capturing 36% of the market. However, this was a marked decline from the previous quarter when its dominance was 44%.
Evidently, much of this pie was grabbed by the decentralized finance (DeFi) sector, which increased its market share from 23% to 32%. The report stated that the memecoin frenzy in April-May and the increased activity by AirDrop hunters contributed to the rise of DeFi protocols.
However, a closer examination revealed that not everything was hunky-dory in the DeFi industry.
DeFi landscape faces headwinds
The total value locked (TVL) in the smart contracts of various DeFi applications fell 7% from the previous quarter. This after witnessing a remarkable recovery of 38% in Q1, coming from the lows of the 2022 bear market.
The TVL is the most important indicator of a DeFi protocol’s growth and reflects the overall sentiment in the market. The higher the TVL, the more trustworthy the platform is perceived to be.
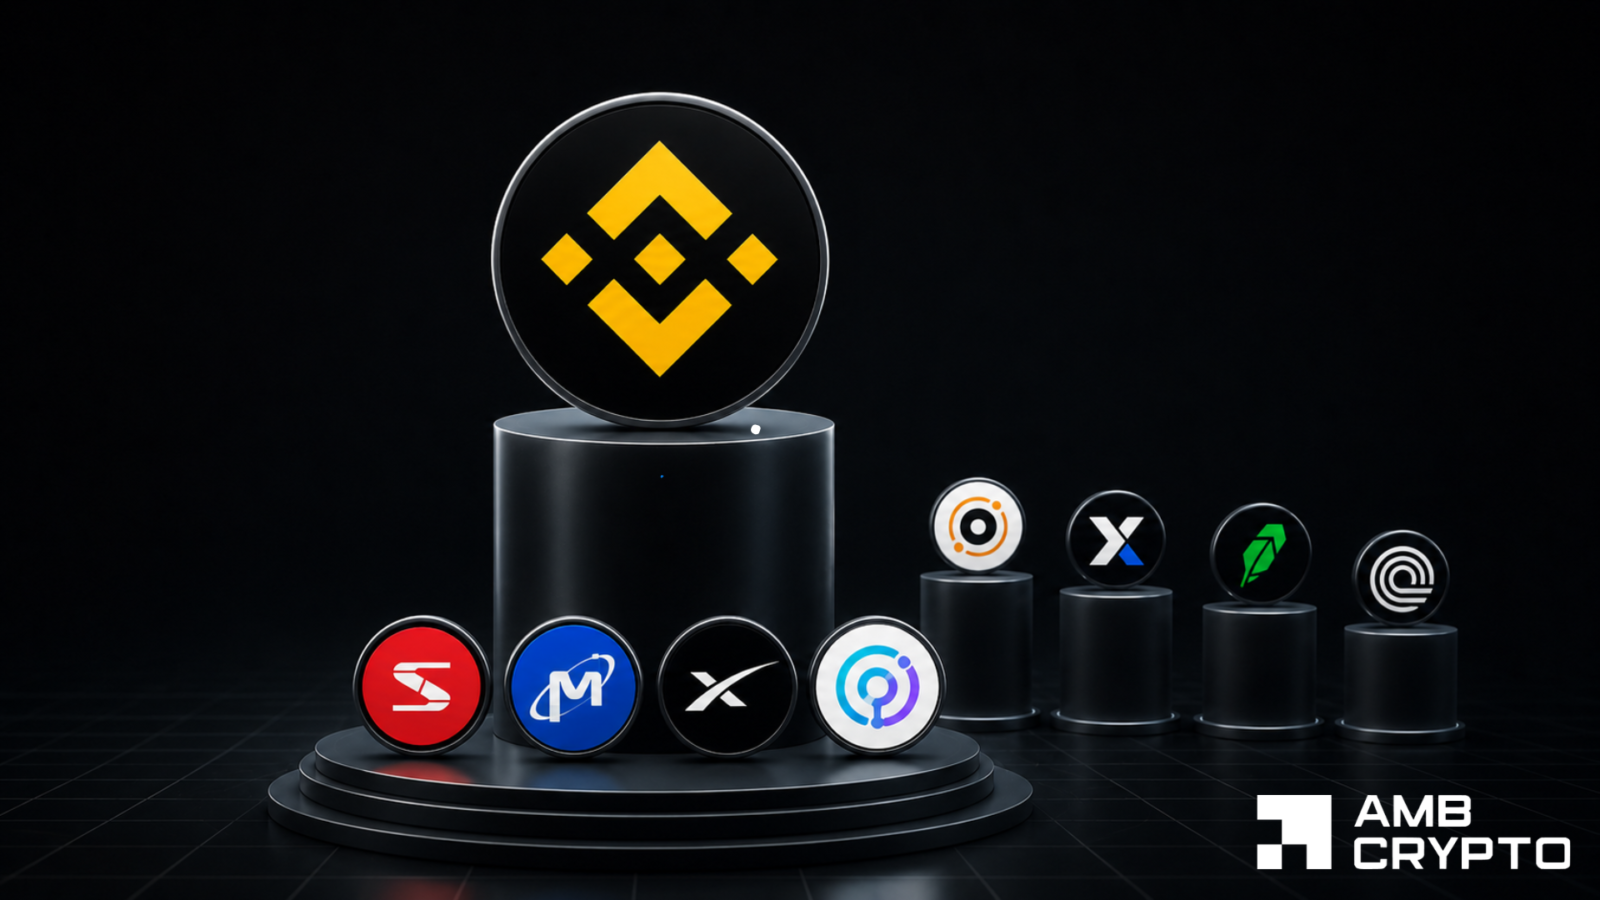
One of the primary reasons behind the drop in TVL could be the growing regulatory clampdown by U.S.-based regulatory agencies. According to the report, BNB Chain suffered a significant 19% drop in its TVL, the most among all blockchains.
The lawsuit targeting the parent company Binance [BNB] clearly created a trust deficit among BNB Chain’s user base and they could have withdrawn their assets.
Another aspect which could be factored in was extended periods of low volatility in the market during Q2. The absence of bullish and bearish forces compelled users to stay away from trading activities like lending and borrowing.
According to DeFiLlama, the volumes across decentralized exchanges (DEX) stagnated in the second quarter, recording a monthly average of just around $71 billion.
Contrast this with Q1 when the monthly average DEX volume was $96 billion and witnessed a rise in each successive month.

State of NFT sector
The NFT market was also not insulated from the market downturn. The total trading volume registered a substantial drop of 38% in Q2 to land at $2.9 billion. However, the drop in sales was not as severe. Compared with Q1, the total sales count decreased by a little over 9%.

Analyzing the above two data sets, the report highlighted that though large-volume trades, including professional, could have declined, the individual traders didn’t wither away. This was an indication that there was sustained interest in NFTs.
Ordinals explosion
The report also traced the growth trajectory of Ordinals, the protocol powering the minting of fungible and non-fungible tokens on the Bitcoin [BTC] network. Ordinals took a giant leap in Q2, exploding 2834% in trading volume.
There was growing interest among new retail traders for the technology, seen during the BRC-20 token mania in May, which resulted in record-breaking traffic on the Bitcoin network.
As per the latest data from Dune, more than 15 million Ordinals inscriptions have been minted. However, as seen from the graph below, the rate of minting came down drastically in June.