GOAT price prediction – Short term gains ahead, but watch out for THIS!
A move towards $1.2 may be likely, but what can come next?
- Goatseus Maximus retained its bullish structure and momentum for a majority of the last two weeks
- Volatility and a liquidation cascade upwards were likely due to short liquidations clustered around $1.2
Goatseus Maximus [GOAT] was able to set another all-time high at $1.25 as its market cap pushed to nearly $1.26 billion (There are a billion GOAT tokens in circulation). The token saw new gains heading into the weekend, with the crypto likely to push even higher based on the short-term liquidation map.
GOAT surges past $1, reaches $1.25
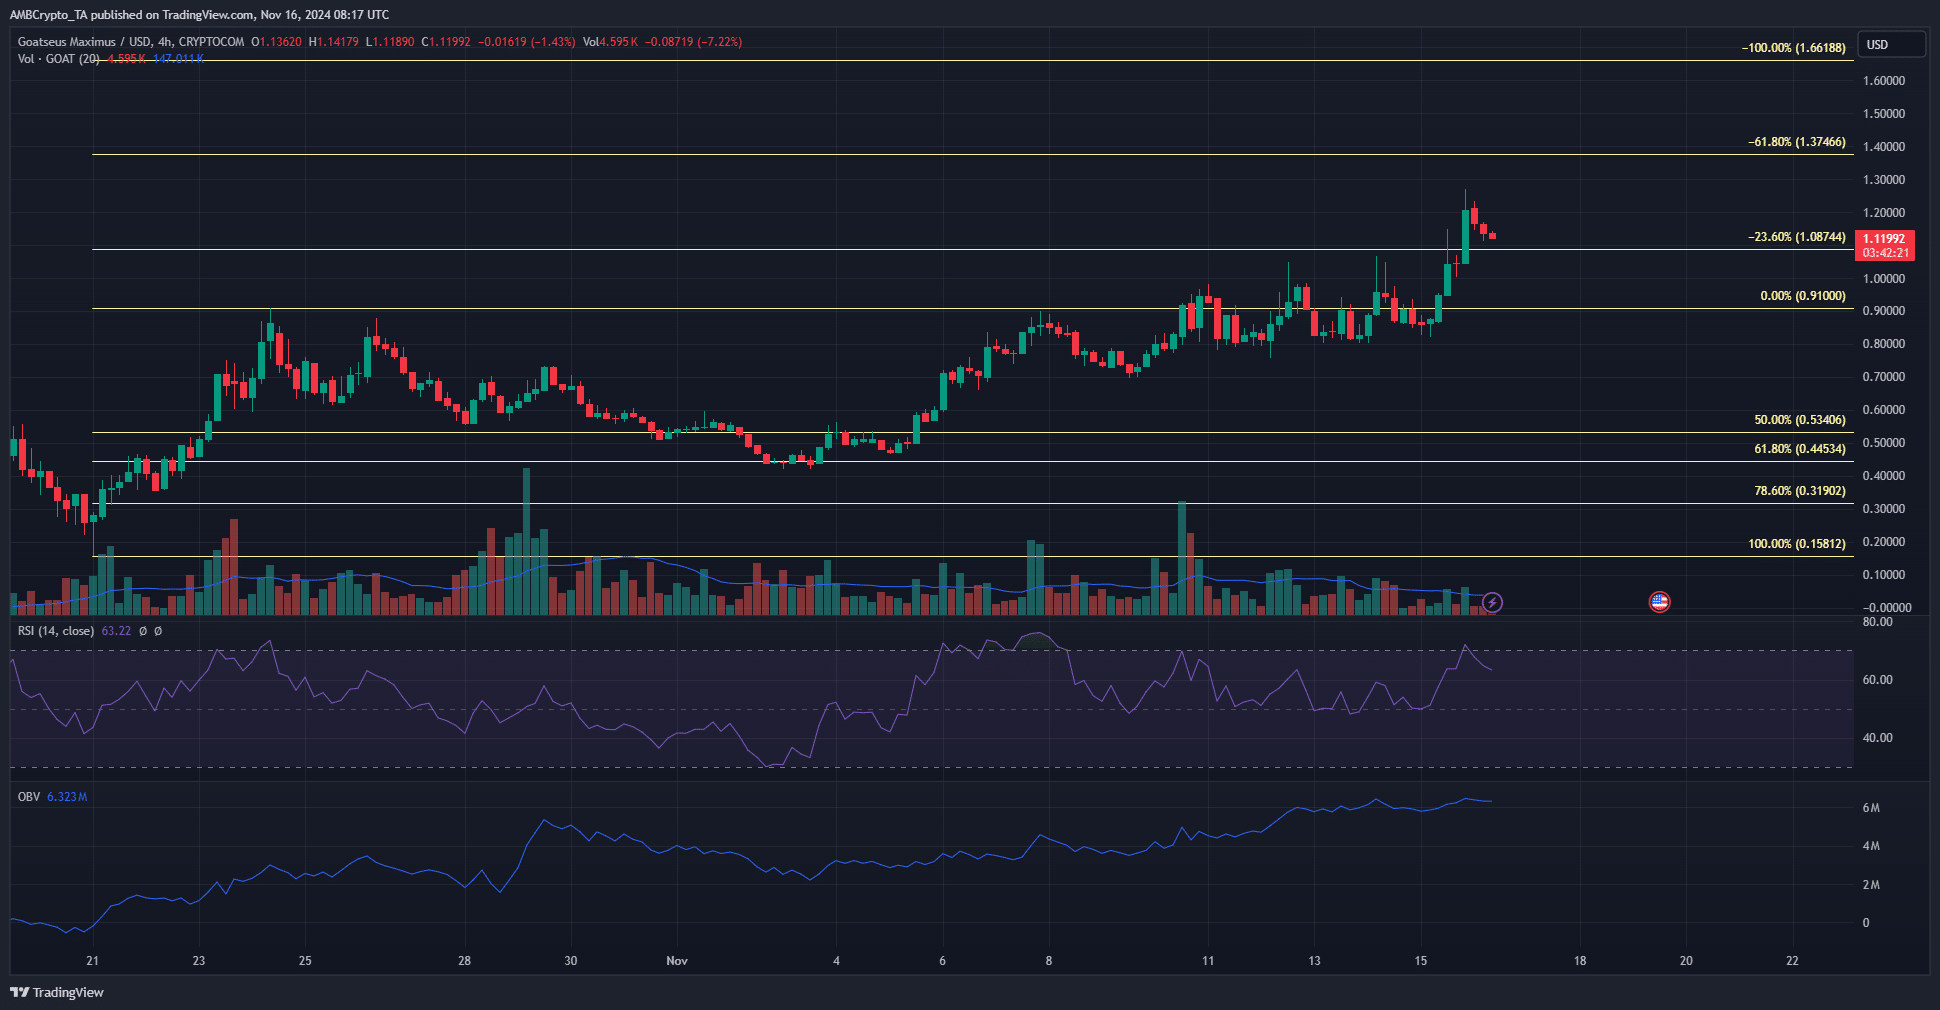
The market structure on the 4-hour chart was bullish and has been so since the first week of November. The memecoin saw its momentum stall around the $1-level over the past few days, but it saw a decisive breakout on Friday, 15 November.
The RSI on the 4-hour chart has also been above neutral 50 for the past two weeks. Alongside the price setting higher highs and higher lows, the RSI reinforced the bullish picture for GOAT.
The OBV has been steadily trending higher too – Another sign that bulls have been dominant. One concern that bulls might have was the drop in trading volume since 11 November. Finally, the trading volume has been below average during this week’s trading.
Liquidation map hints at short-term gains
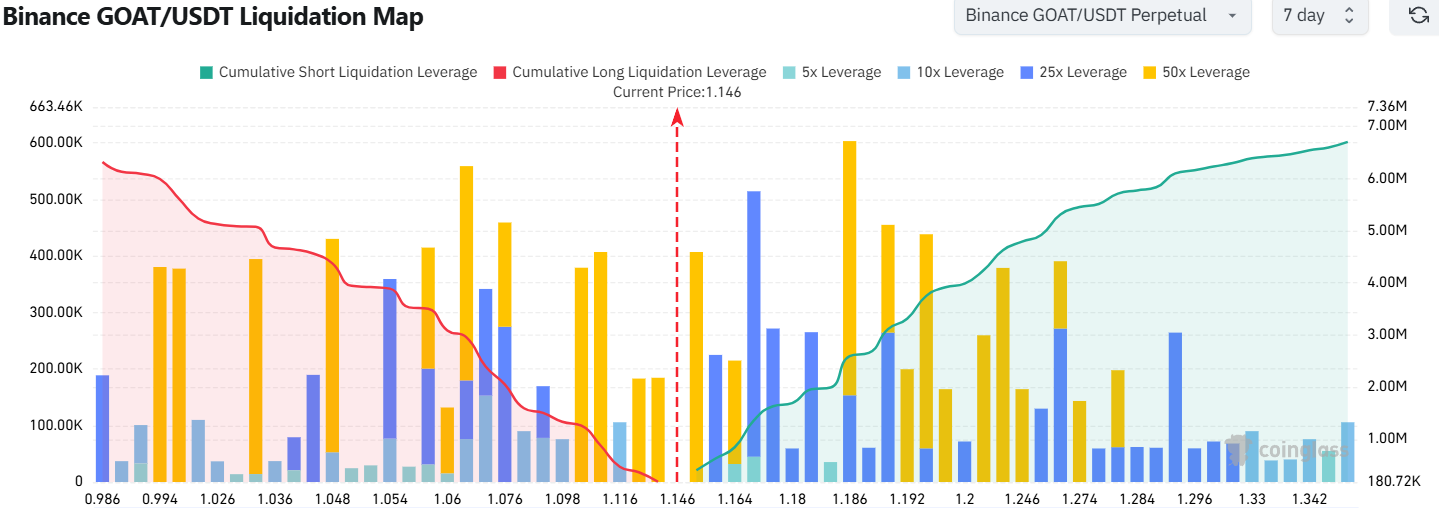
AMBCrypto found that there were a large number of short liquidation levels from $1.16-$1.2. They outweighed the long liquidations that lay from $1.146 to $1.05. This meant that a move higher might be likely since the price is usually drawn to liquidity.
Realistic or not, here’s GOAT’s market cap in BTC’s terms
Hence, a move towards $1.2 appeared likely at press time, but what can come next? Well, the low trading volume hinted at weakness from the buyers.
The liquidation map highlighted potential for a liquidation cascade to drive short-term gains. However, it also presented a chance for the price to reverse from $1.2-$1.3 and fall towards $1.
Disclaimer: The information presented does not constitute financial, investment, trading, or other types of advice and is solely the writer’s opinion.