Goatseus Maximus [GOAT] gains 56% in two days, targets $0.9 flip
The market structure on the 4-hour chart is bullish as GOAT pushed past the $0.566 level.

- GOAT has a bullish lower timeframe market structure.
- The DMI index showed that a strong uptrend was in progress.
Goatseus Maximus [GOAT] is up by 56% in 32 hours and is likely to go further higher.
The $722 million market cap memecoin has been in a phase of retracement over the past ten days but saw quick gains that began on the 4th of November.
The trading volume has also been in decline, but this was beginning to change. On the lower timeframes, the upward momentum has been strengthening, and capital flow was on the rise.
Goatseus Maximus begins trending upward
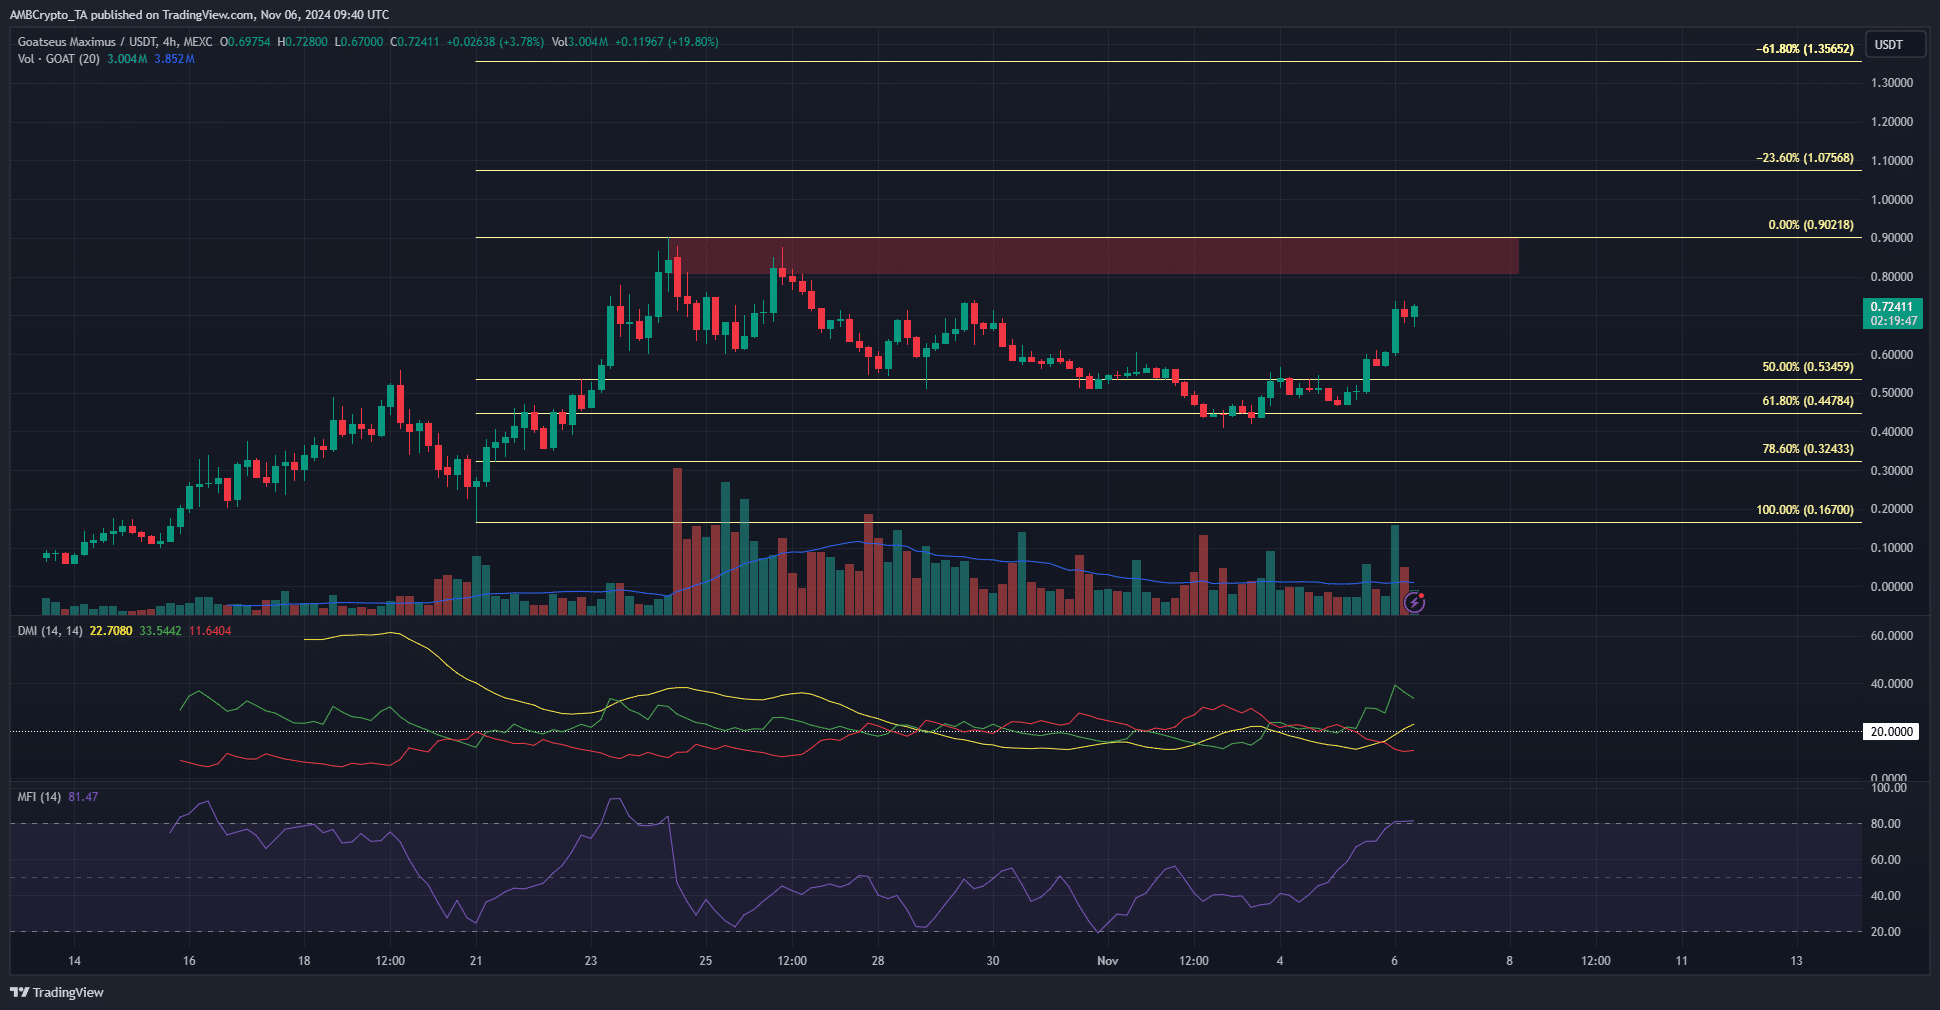
The market structure on the 4-hour chart is bullish as GOAT pushed past the $0.566 level. It has formed a series of higher highs and higher lows since the 4th of November.
The DMI agreed with the bullish structure and reflected a strong upward trend in progress, with the ADX (yellow) and +DI (green) above 20.
At the same time, the MFI had pushed northward and was in the overbought territory.
A bearish divergence in the coming days could foretell a correction from the $0.9 resistance zone. In the next few days, a move toward this region is expected.
A breakout depends on market sentiment and the trend behind Bitcoin [BTC].
Short-term sentiment and demand favors bulls
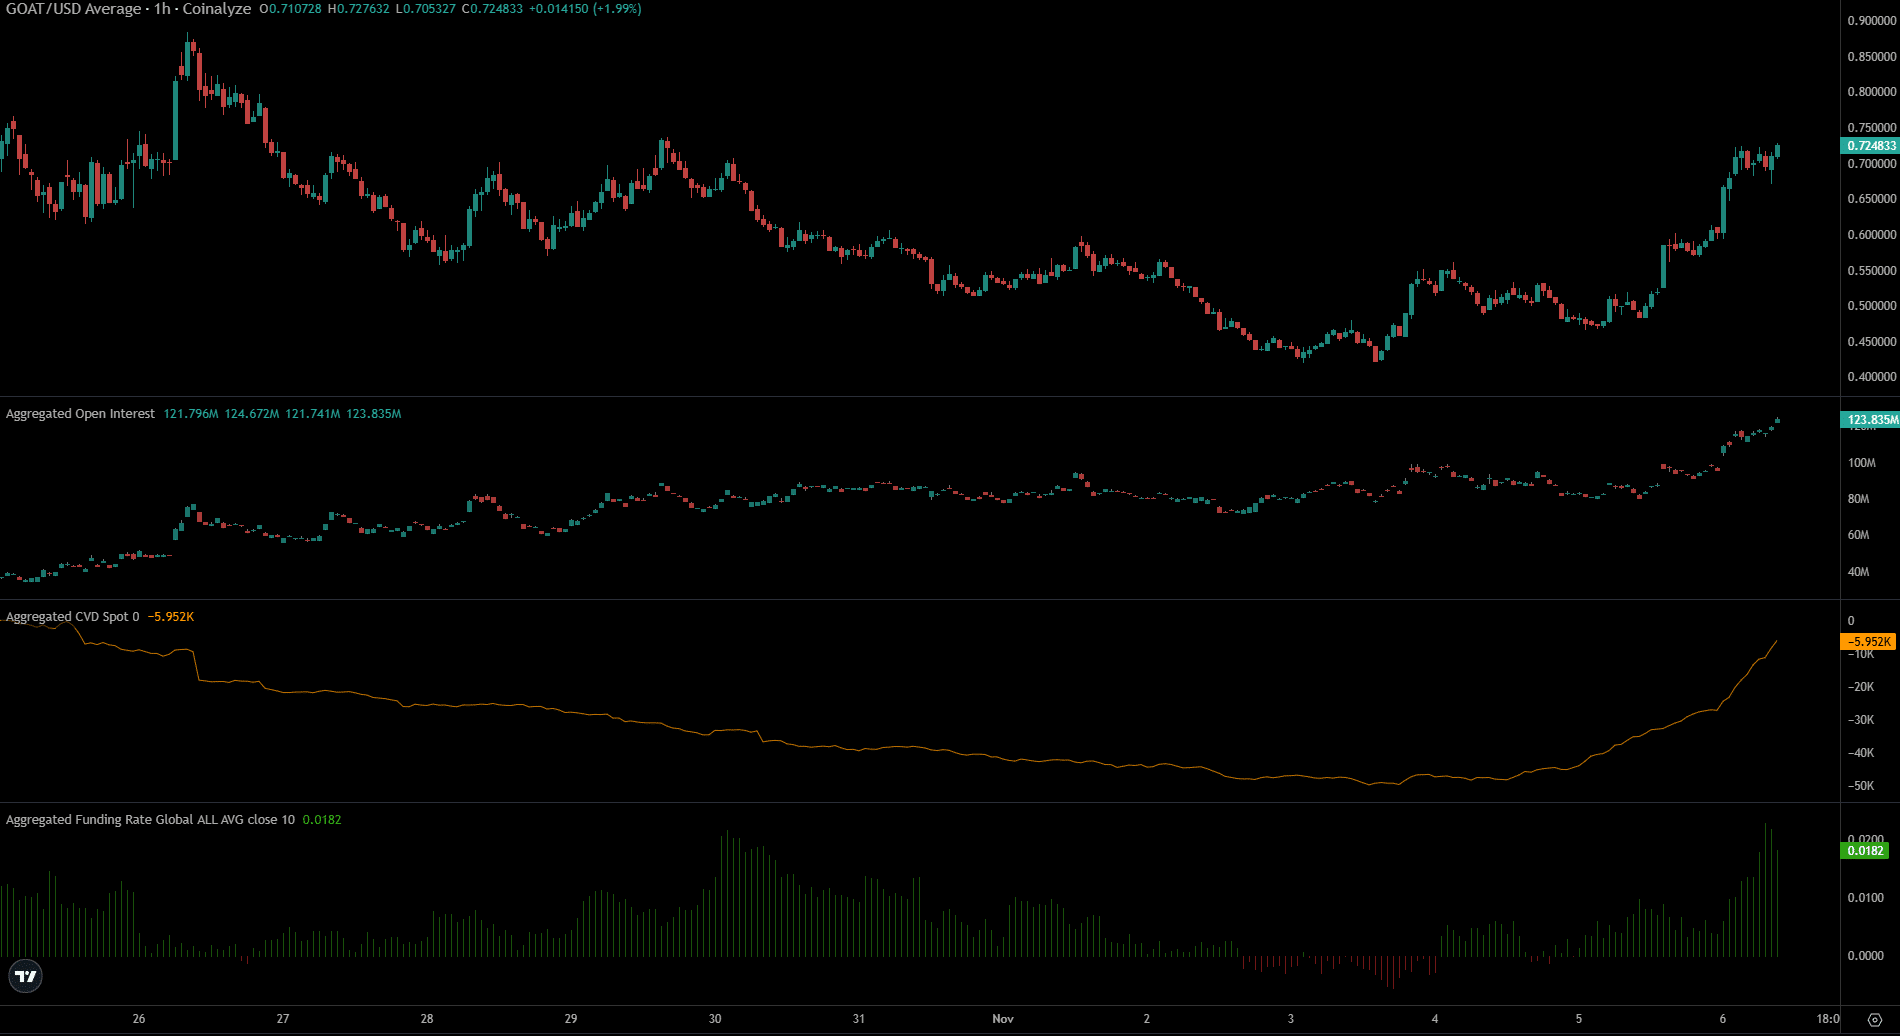
The spot CVD and the Open Interest rose swiftly in the past 24 hours. This was a sign that there was demand in the spot markets and that the speculative interest was keen.
Together, they pointed toward a sustainable run northward, which could extend beyond $0.9.
Is your portfolio green? Check out the GOAT Profit Calculator
The high Funding Rate meant that the sentiment was strongly bullish, but also that the spot and derivatives prices differed. Overall, the local highs from the $0.9 area represented a supply zone.
Traders and investors can wait for the $0.9 and the psychological $1 levels to be flipped to support before re-entering long positions.
Disclaimer: The information presented does not constitute financial, investment, trading, or other types of advice and is solely the writer’s opinion


