Analysis

Harmony [ONE]: With the value area lows breached, will the buying pressure continue
Posted:
Journalist

Disclaimer: The findings of the following analysis are the sole opinions of the writer and should not be considered investment advice
Harmony dipped to $0.135 lows, but was quick to bounce in recent hours and signaled that further upside was possible in the next few days. The indicators noted that momentum and selling pressure had been strong in the past few days. The short-term market structure was also bearish. Despite these misgivings, higher timeframes showed that ONE had reached a logical retracement level to buy the asset.
ONE- 2 hour chart
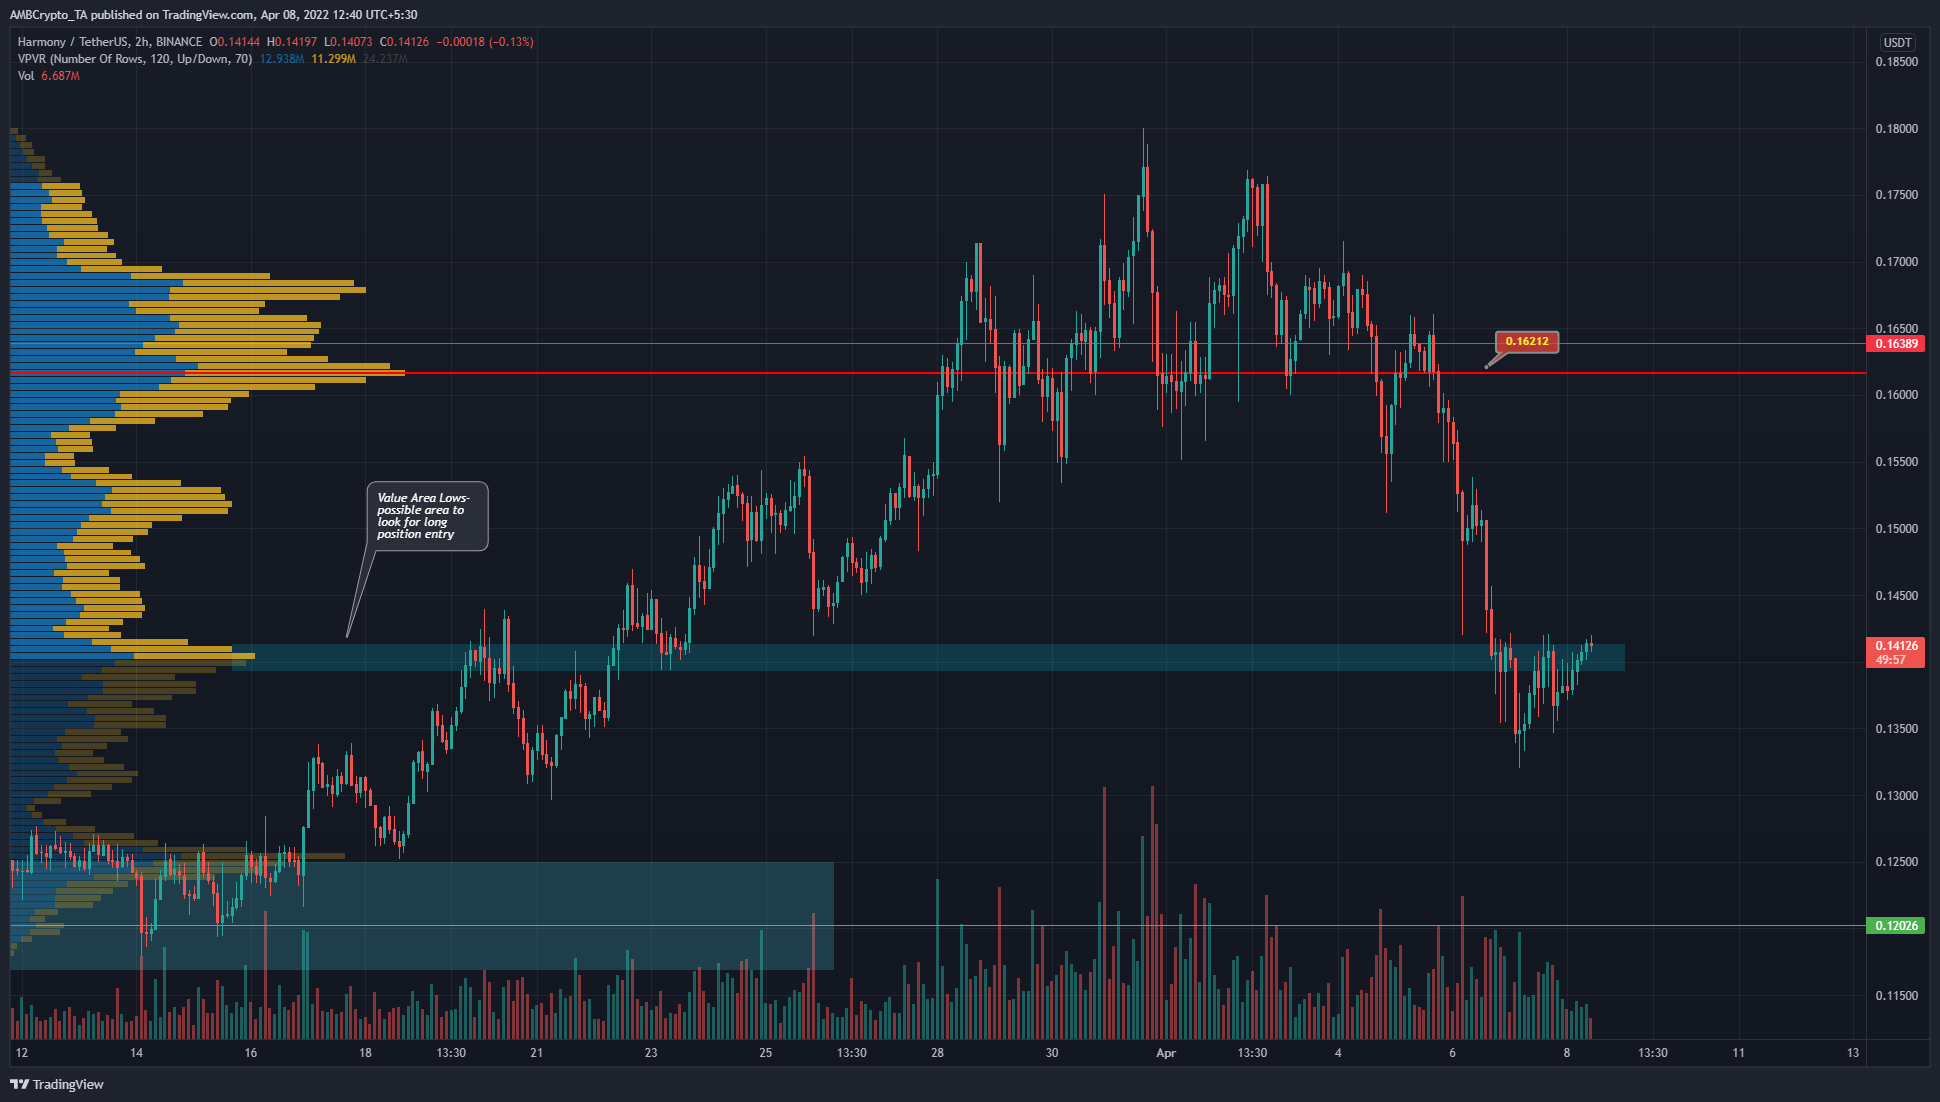
Source: ONE/USDT on TradingView
The Volume Profile Visible Range showed the Value Area to extend from $0.14 to $0.0.175. The Point of Control lay at $0.162 and represented the area where the most trading volume has occurred in the visible range.
At the time of writing, the price dipped to $0.135, beneath the Value Area Lows at $0.14 but bounced back quickly. Moreover, the $0.14 area had been the place from which ONE initiated its late-March rally to the $0.18 highs.
Hence, if sustained buying pressure is seen, a similar rally could take place in the days to come.
Rationale
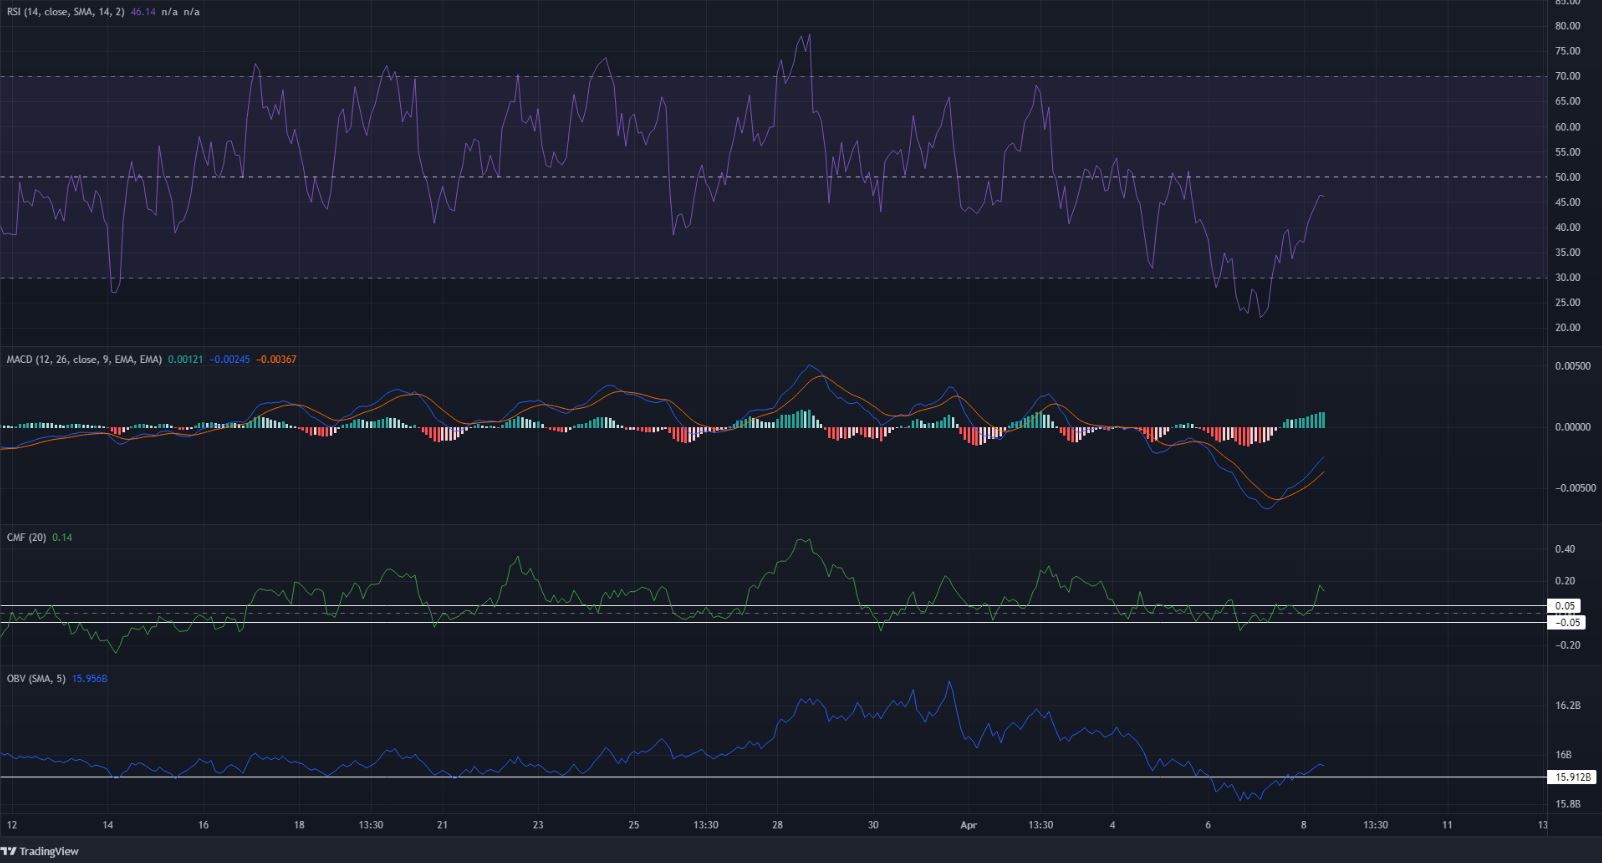
Source: ONE/USDT on TradingView
The RSI was beneath the neutral 50 to show that, on the 2-hour timeframe the momentum behind ONE was still bearish. The MACD presented similar evidence as the MACD line (blue) formed a bullish crossover above the signal line (orange), but this was beneath the zero line. Hence, bearish bias was still present.
The Chaikin Money Flow rose above +0.05 the previous day to show rising buying pressure. The OBV also reclaimed a level that it has held as support in the past three weeks.
Conclusion
Although the near-term price action and momentum were bearish, swing traders can look at the charts and see a good risk-to-reward setup to enter a long position at. The OBV climbed back above a level it has not breached since February.
This was important because rallies have been sparked in this area for Harmony in the past couple of months. There was a 45% rally in mid-March and another, nearly 54% rally in late February.