Ethereum finds a local bottom but these levels can save your portfolio

Disclaimer: The findings of the following analysis are the sole opinions of the writer and should not be considered investment advice
Ethereum saw a fall in gas prices, likely prompted by a decline in DeFi usage. The much-anticipated Merge was not likely to rescue Ethereum from bearish jaws on the price charts just yet.
The path of least resistance for the king of altcoins appeared to be toward the south, although a bounce from a demand zone was ongoing. How high could this bounce last, and what are the critical resistance levels to watch out for?
ETH- 12 Hour Chart
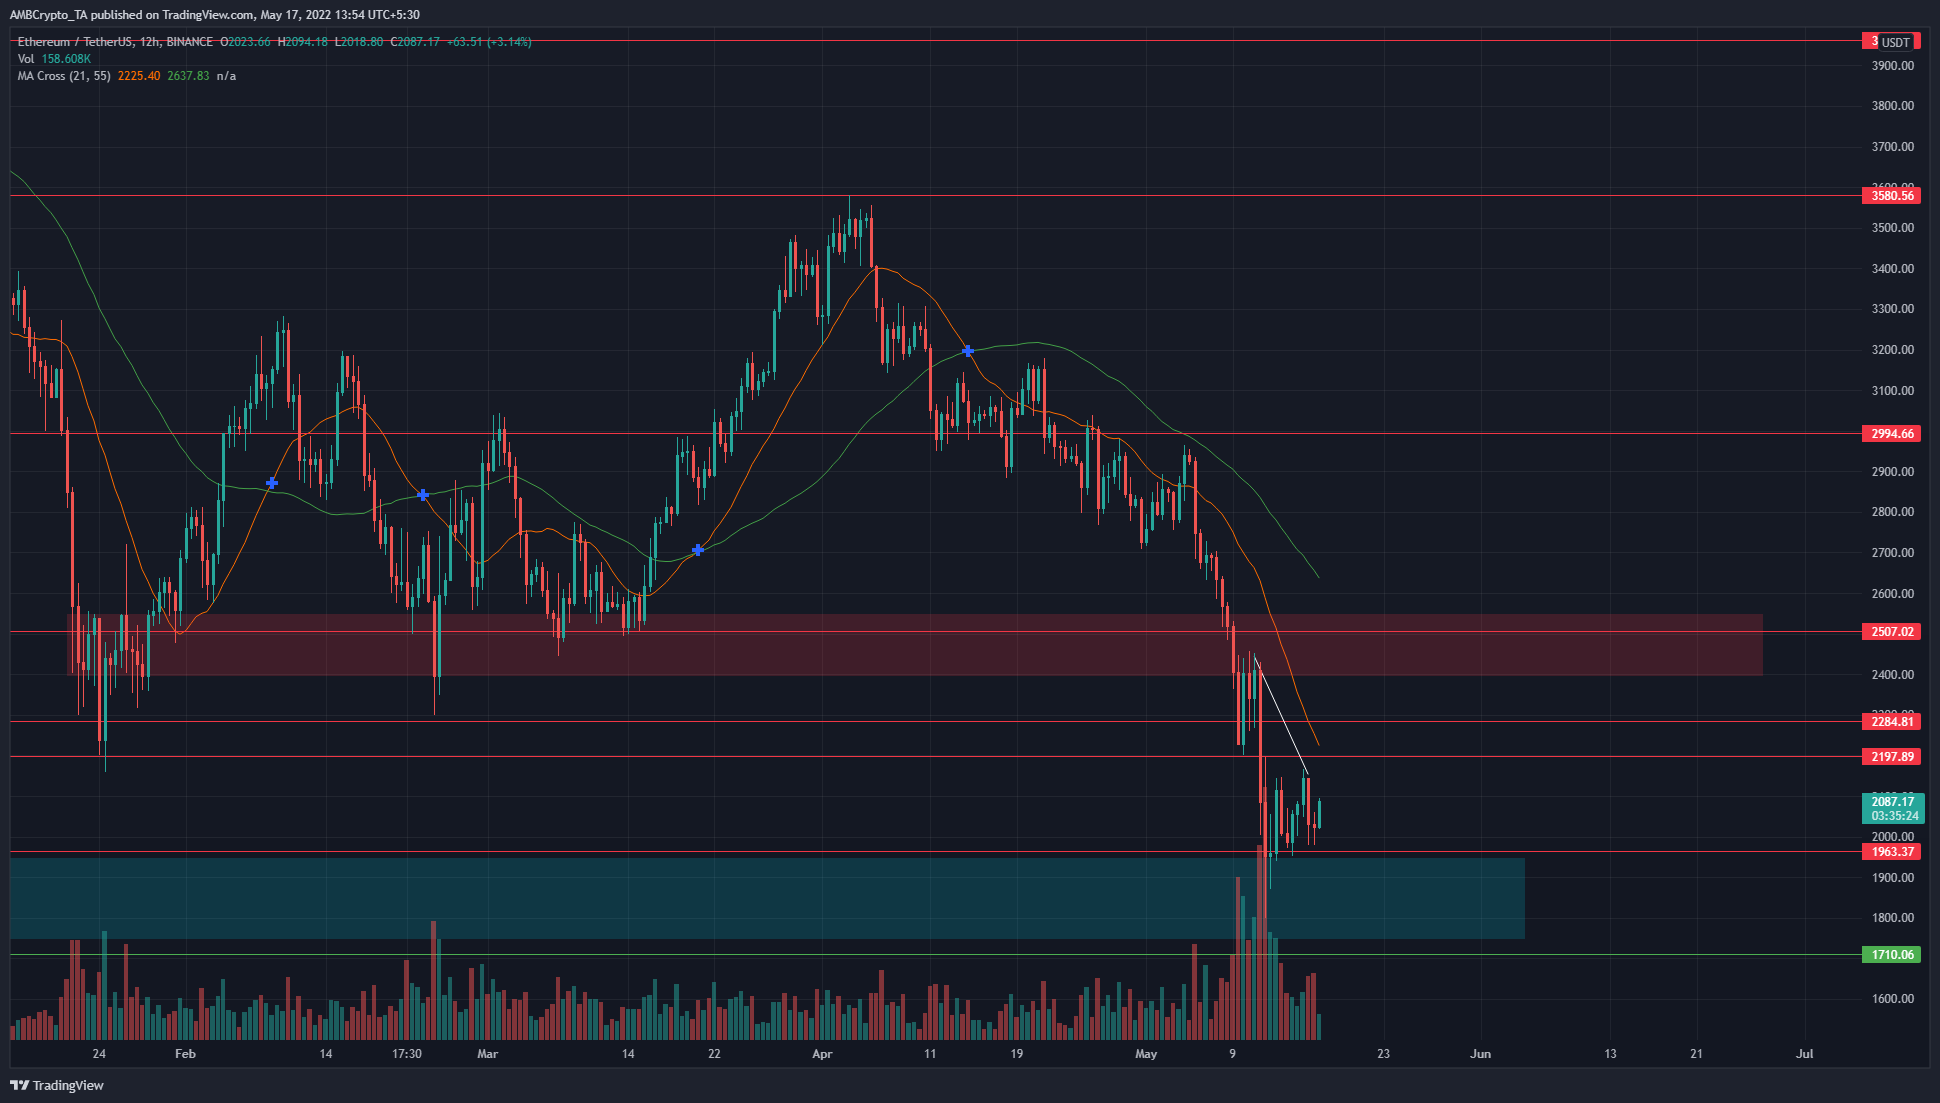
The trend for ETH has been bearish since late November, after being unable to climb past the $4,868 mark and breaking down below the $4,400 level as well. After retracing as low as $2,180 in late January, ETH rallied to $3200 and then to $3,500 in early April. This surge appeared to break the previously bearish market structure, but the bulls were unable to defend the $3200 area.
Over the past two weeks, there has been considerable selling pressure on Bitcoin and Ethereum, due to various factors. Bitcoin has mirrored certain stock market indices in its momentum in recent days, and the selling pressure and FUD from the LUNA incident drove Bitcoin to $24k, and Ether to the $1,800 mark.
Therefore, the structure remains bearish, but ETH has a strong demand zone in the $1,750-$1,950 area. In the past few days, a bounce from this area was seen, but the price formed a hidden bearish divergence on the 12-hour chart already.
Rationale
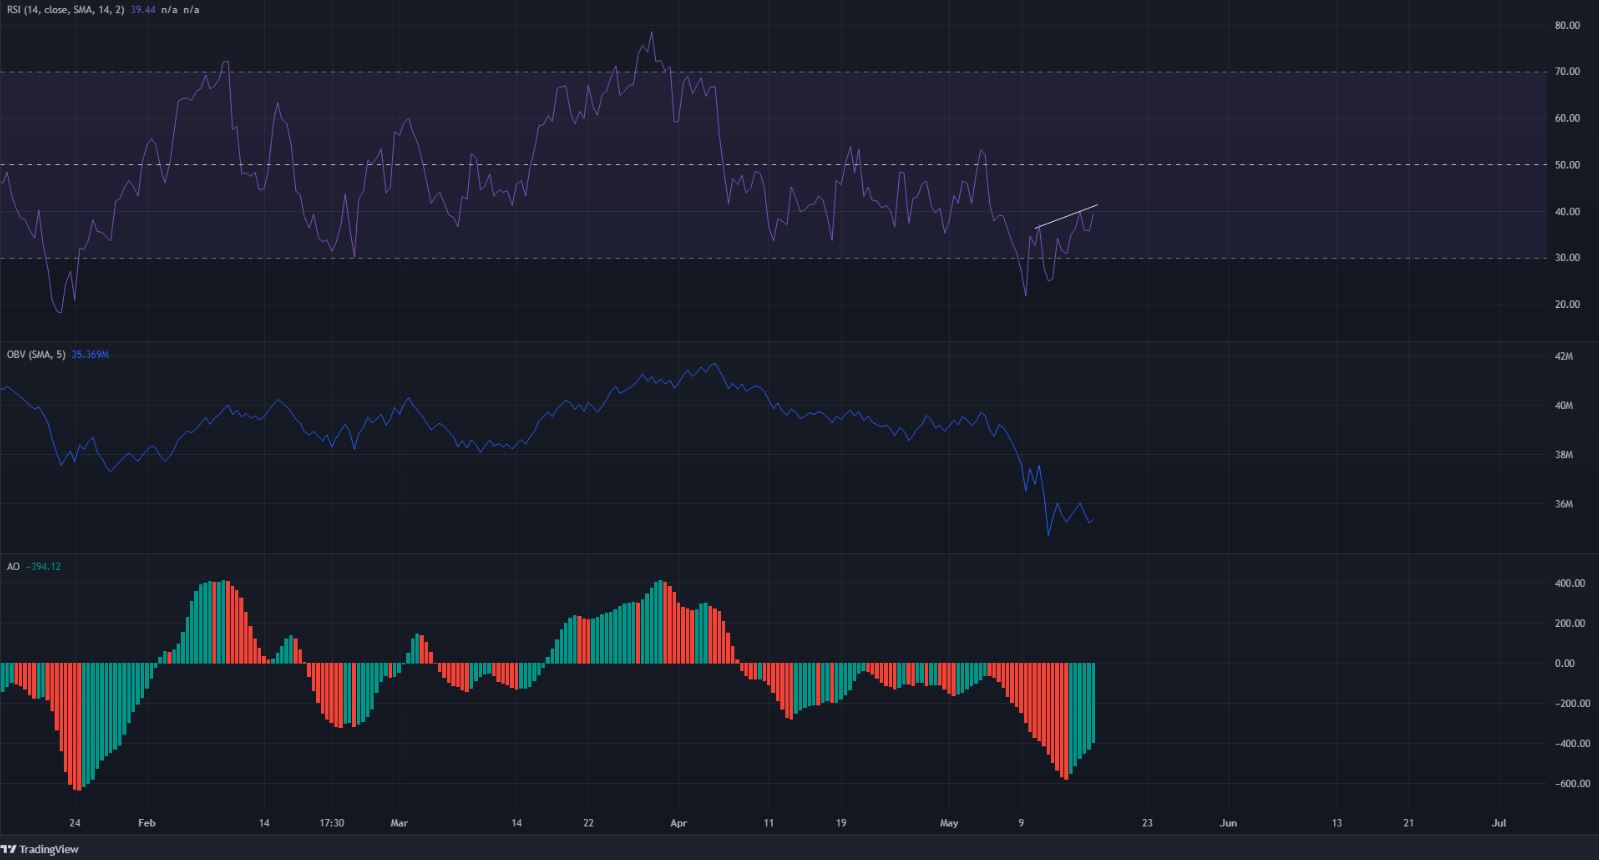
The RSI made a higher high (white) while the price made a lower high. This was a hidden bearish divergence, a signal that the previous downward trend was likely to continue. Moreover, the RSI has been below the neutral 50 mark since early April, further proof of momentum being to the downside. The AO was also well below the zero line.
The OBV appeared to be picking up in February and March but has come crashing down in the past few weeks. Strong buying pressure was not yet shown on the OBV.
Conclusion
The momentum was in favor of the bears, and there was no strong demand for ETH in sight yet. The bearish divergence was likely an early signal of further downside for ETH, and there could be a rejection from the $2,200 level in the next few days. Beyond $2,200, the $2,500 level was also likely to pose heavy resistance, and long-term investors must be cautious buying the Ethereum dip.