Has Shiba Inu begun its recovery, how far can it go

Disclaimer: The findings of the following analysis are the sole opinions of the writer and should not be taken as investment advice
Shiba Inu held the 13th rank on the CoinMarketCap, just behind Dogecoin at 12th. Shiba Inu had a market cap of $19.67 billion. It has been in a downtrend since late October when the prices reached an ATH of $0.08854 (Note: All SHIB prices in the following article are 1000x the actual value, to do away with long decimal places. For example, a SHIB price of $0.00003319 was written as $0.03319).
At the time of writing, SHIB had tested an important area on the charts and climbed back above a level of support. Has Shiba Inu really turned a corner on the charts? If so, how high can it go from here on?
SHIB: 12-hour chart
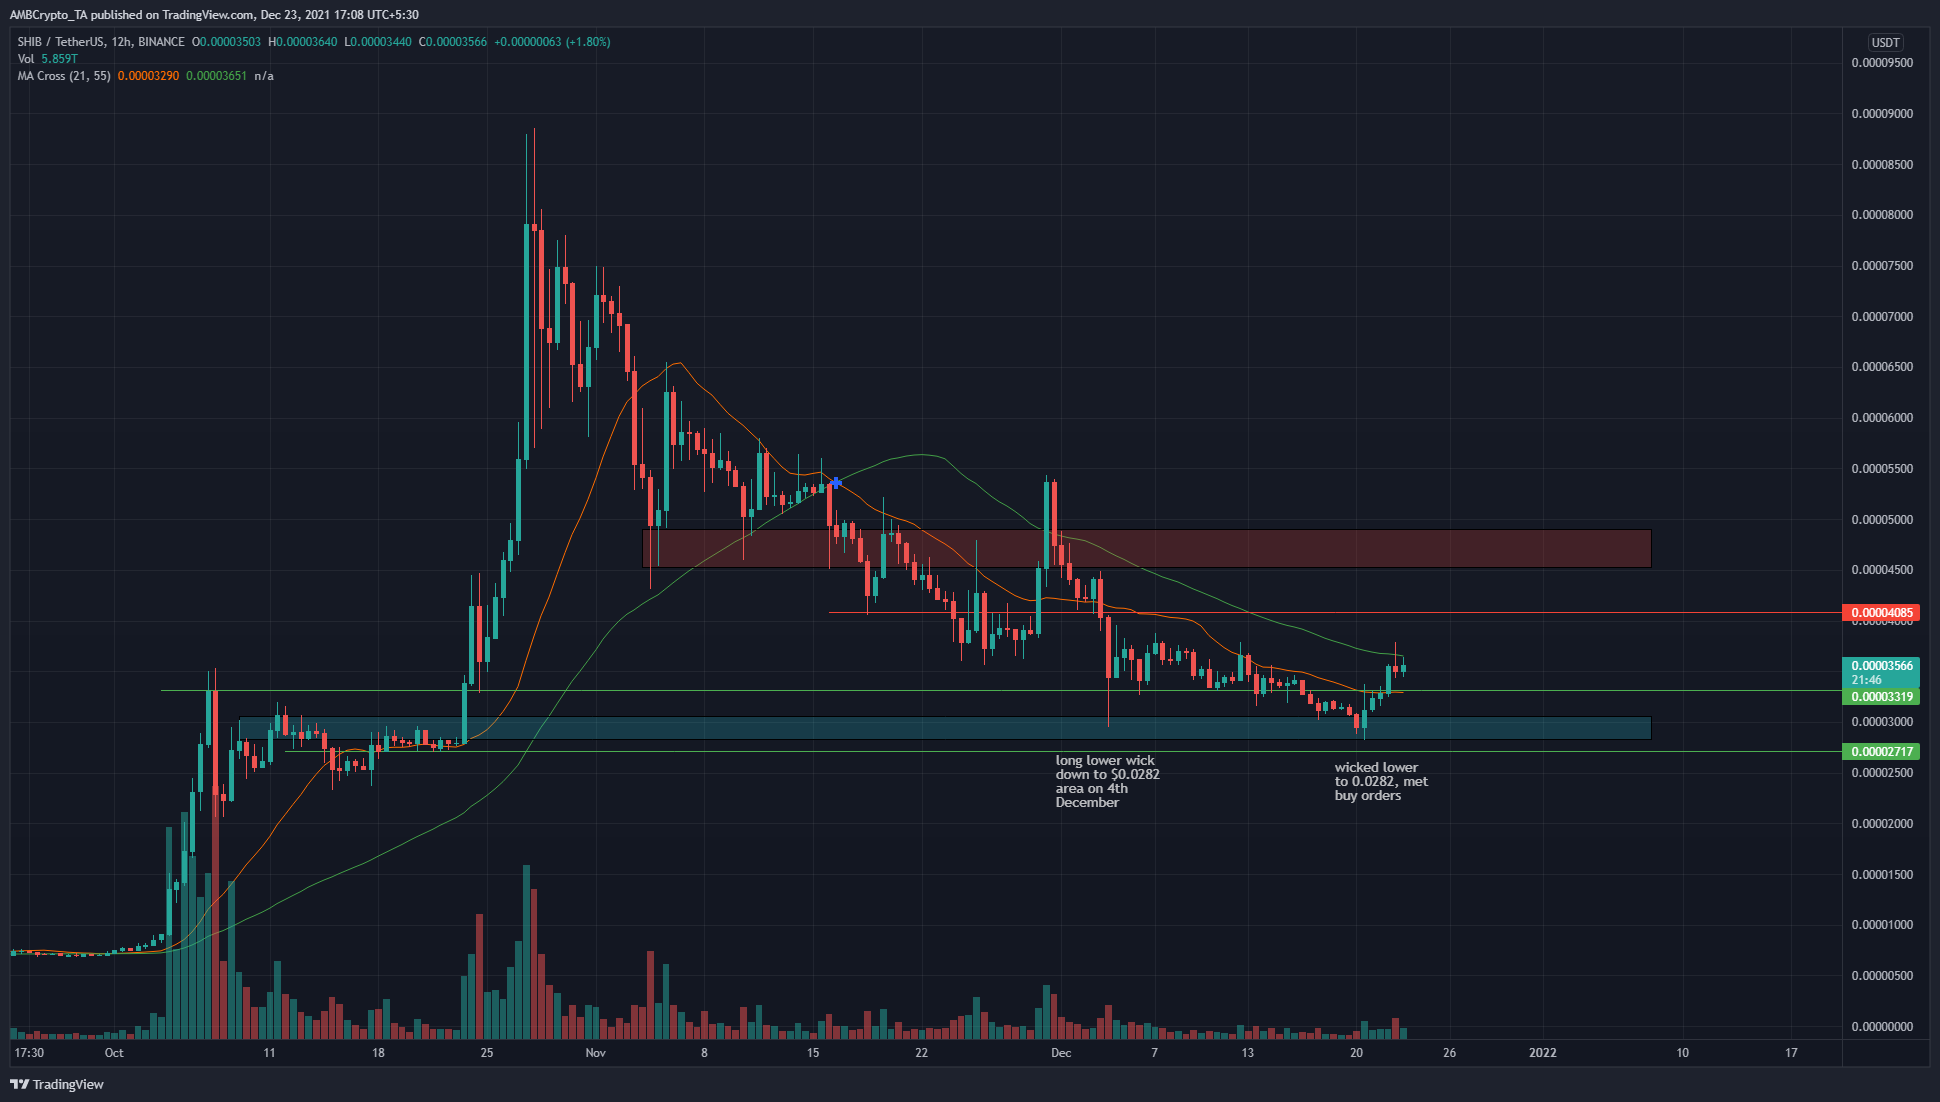
Generally, strong downtrends are followed by a long accumulation phase before a strong move back toward former highs. SHIB has not had this accumulation phase for months together, though it did trade sideways just above the $0.03319 support level for a couple of weeks.
This suggested that SHIB was more likely to see a bounce, perhaps as high as $0.04 and the $0.046 area (red box). A retest of the $0.0331 level of support could be used to enter long positions.
The most recent candle close had a long upper wick, suggesting sellers exhausted the buyer strength temporarily. This turn of events could see the support level retested. Another thing to note is the 21 SMA (orange) had been acting as resistance in the past few weeks, but the price climbed above it and could flip it to support. The 55 SMA (green) offered resistance to the price.
Rationale
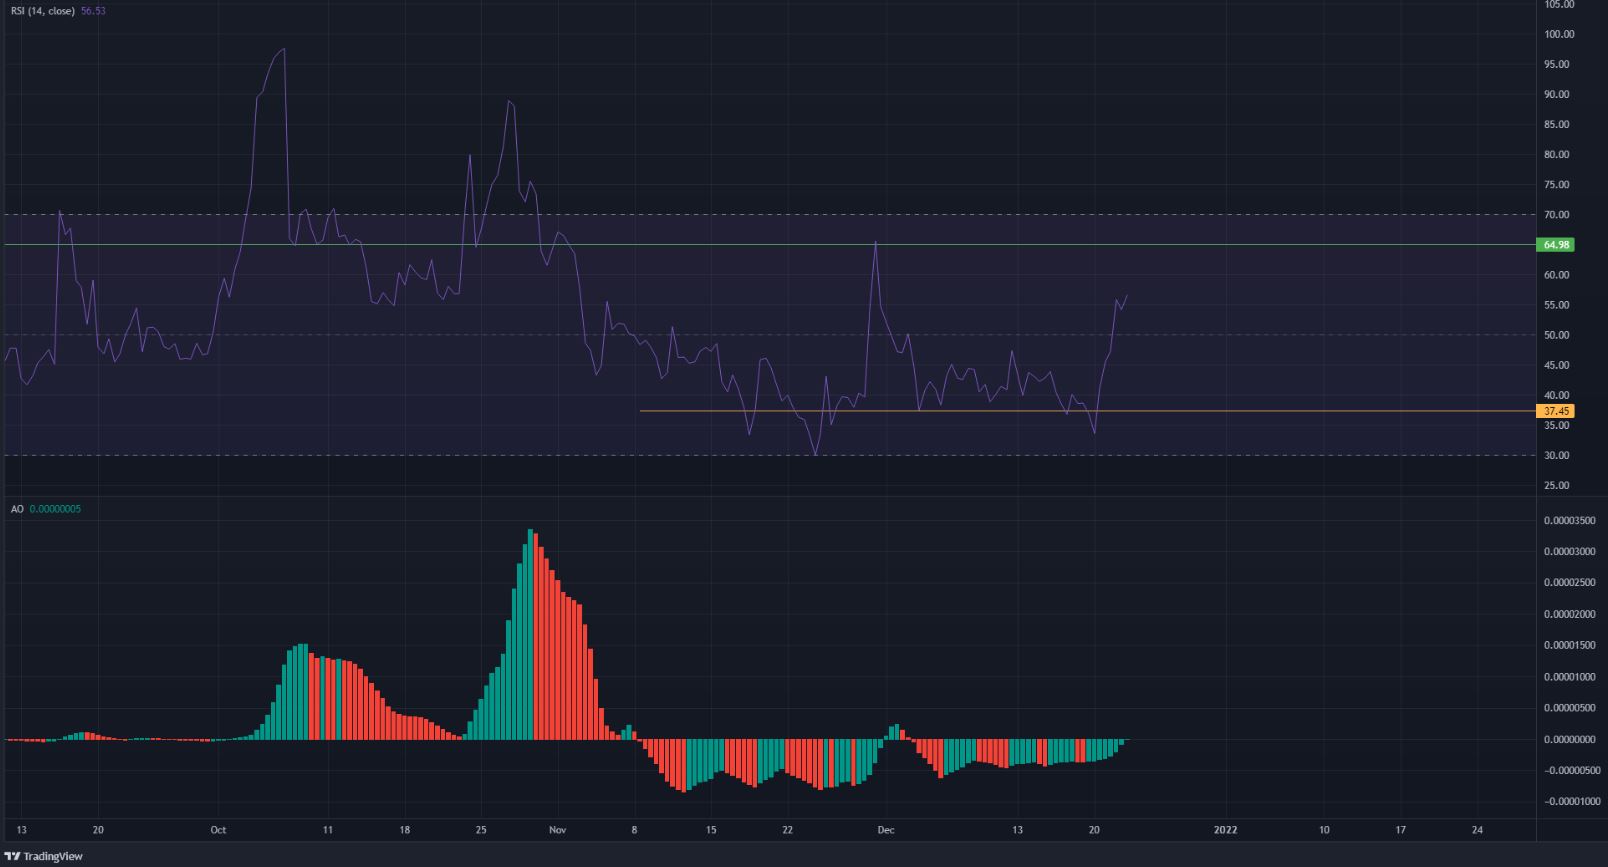
Some clues about SHIB strength were seen on the RSI. The 64.98 level on the RSI was the one to beat for SHIB bulls. A move above this, and retest, preceded SHIB’s rally from $0.0332 t0 $0.088. A rejection there would indicate the sellers remained strong.
The RSI has climbed back above the neutral 50 value, which is another level of importance that SHIB could only breach once over the past two months. The Awesome Oscillator was moving toward the zero line and could soon form a bullish crossover.
Conclusion
In conclusion, momentum has appeared to turn, and important areas on the chart have been tested to find buyers. However, trading volume was nowhere close the what it was during earlier parabolic runs. Conservative targets for this bounce, should it occur off the $0.033 mark, lie at $0.04 and the $0.046-$0.048 pocket of liquidity.