HBAR rallies 39% in a week: Key resistance zones to watch above $0.08
The build-up of liquidity at $0.07 was a sign of a potential price dip toward $0.06 before the upward move resumes.
- Hedera is expected to flip the $0.08 zone from resistance to support in the coming days.
- If HBAR witnesses sustained demand, a move toward $0.11 is likely.
Hedera [HBAR] had been in a long-term downtrend till the 4th of November. Since then, the bullish momentum that seized Bitcoin [BTC] and most of the rest of the crypto market pulled Hedera prices higher.
The token’s daily trading volume increased by 86% and stood at $498.5 million at press time. HBAR regained its bullish structure—how high can the current rally go before a retracement?
The two resistance zones to watch
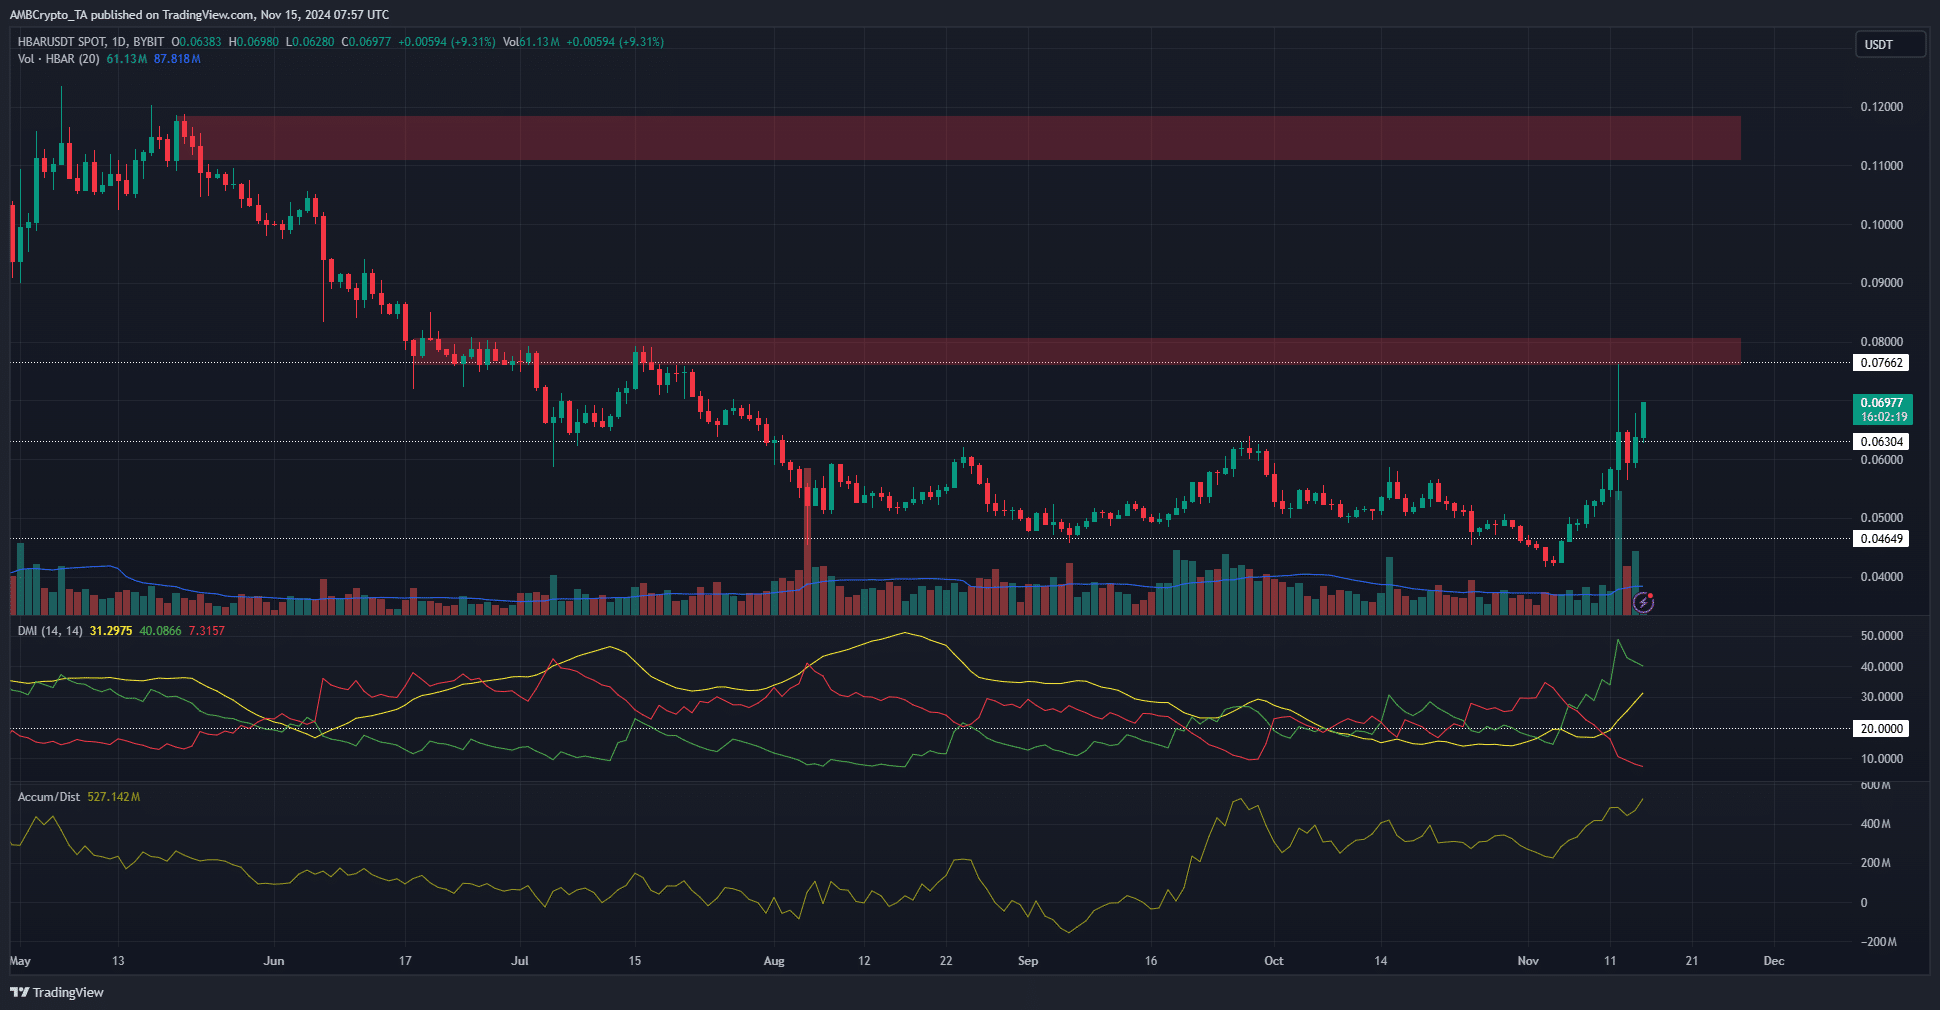
HBAR was in a strong uptrend. The daily structure was bullish and the $0.063 level was broken. This level had been a resistance since August. The recent gains meant the DMI indicator showed that the altcoin was in a strong upward trend.
To support this idea, the A/D indicator was also in an uptrend. It noted increased buying pressure in the past ten days. The recent rally was borne by steady demand.
High volatility on Tuesday, the 12th of November, saw HBAR test the $0.0766 resistance level and face rejection. Since then, the price has rallied above $0.063.
The $0.08 zone was a stern resistance zone in June and July. Similarly, further north, another significant resistance zone at $0.11 was seen. The latter was a bearish order block on the daily chart.
Buying opportunity for HBAR traders?
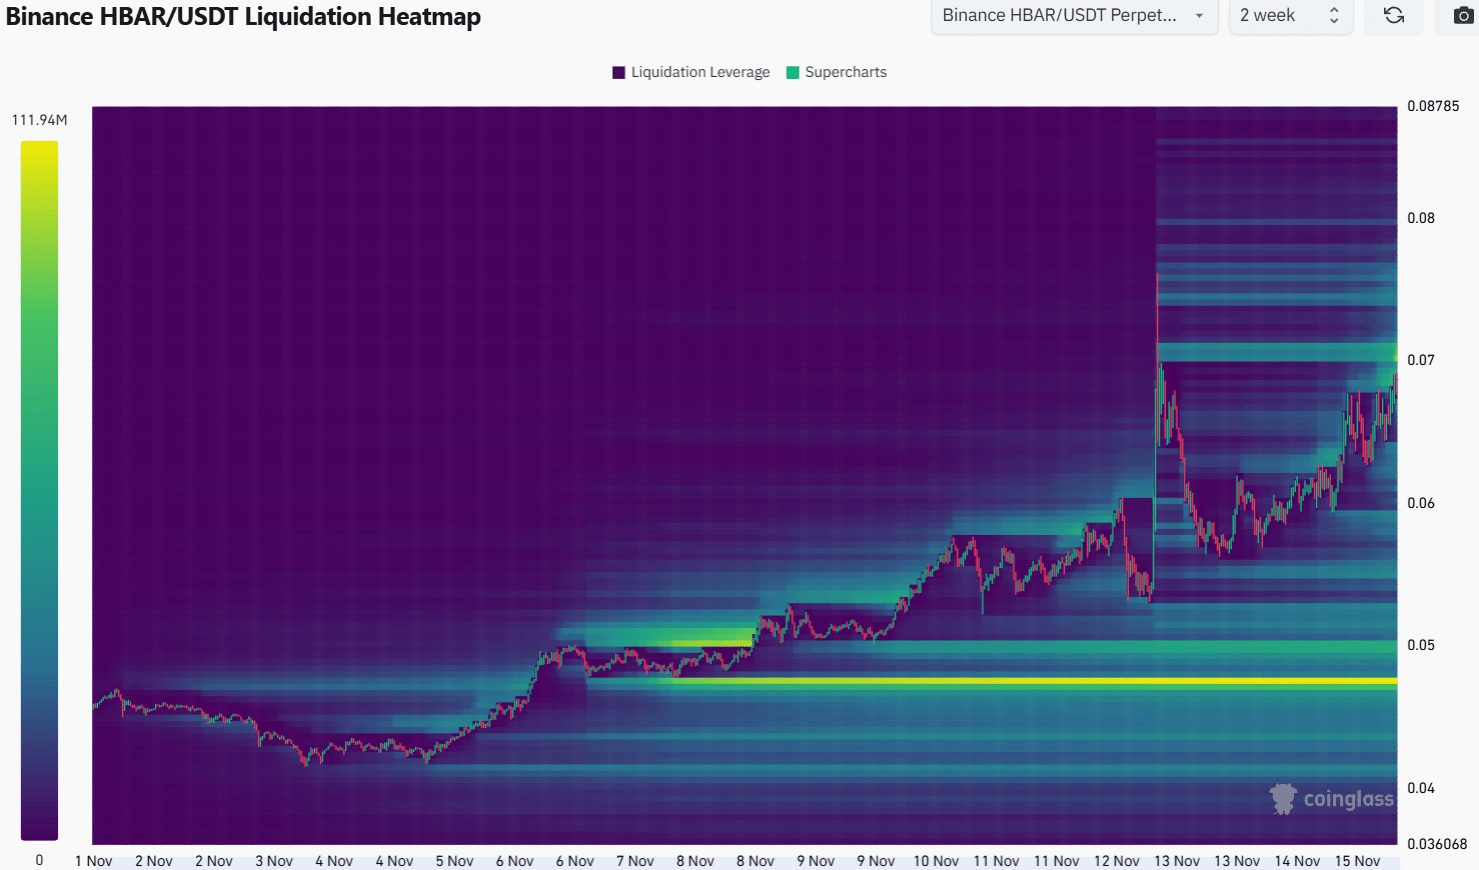
The downtrend of the past few months and the strength of the recent rally meant that there were no sizeable long liquidation pools beyond $0.063. The closest one was at $0.07-$0.0711. This region is likely to be visited soon.
Is your portfolio green? Check the Hedera Profit Calculator
The volatility a couple of days ago was enough for liquidity to build up in this region even though the market was bullish. This isn’t odd. Short position liquidations tend to build up around local highs.
For traders, this liquidity build-up was a sign that, after sweeping this liquidity, HBAR might also dip to $0.064 before resuming the upward move.
Disclaimer: The information presented does not constitute financial, investment, trading, or other types of advice and is solely the writer’s opinion.