Helium has flipped a key area from supply to demand as bulls take control

Bitcoin Dominance fell below 40% even as Bitcoin whales fought to initiate a liquidation cascade at Bitcoin’s near-term range lows. Taken together, this meant that altcoins were likely to be strong in the near-term and strong altcoins could register rapid gains. Helium was one such coin. It flipped a key level from resistance to support, and buyers were likely to push the prices much higher in the days to come.

Source: HNT/USD on TradingView
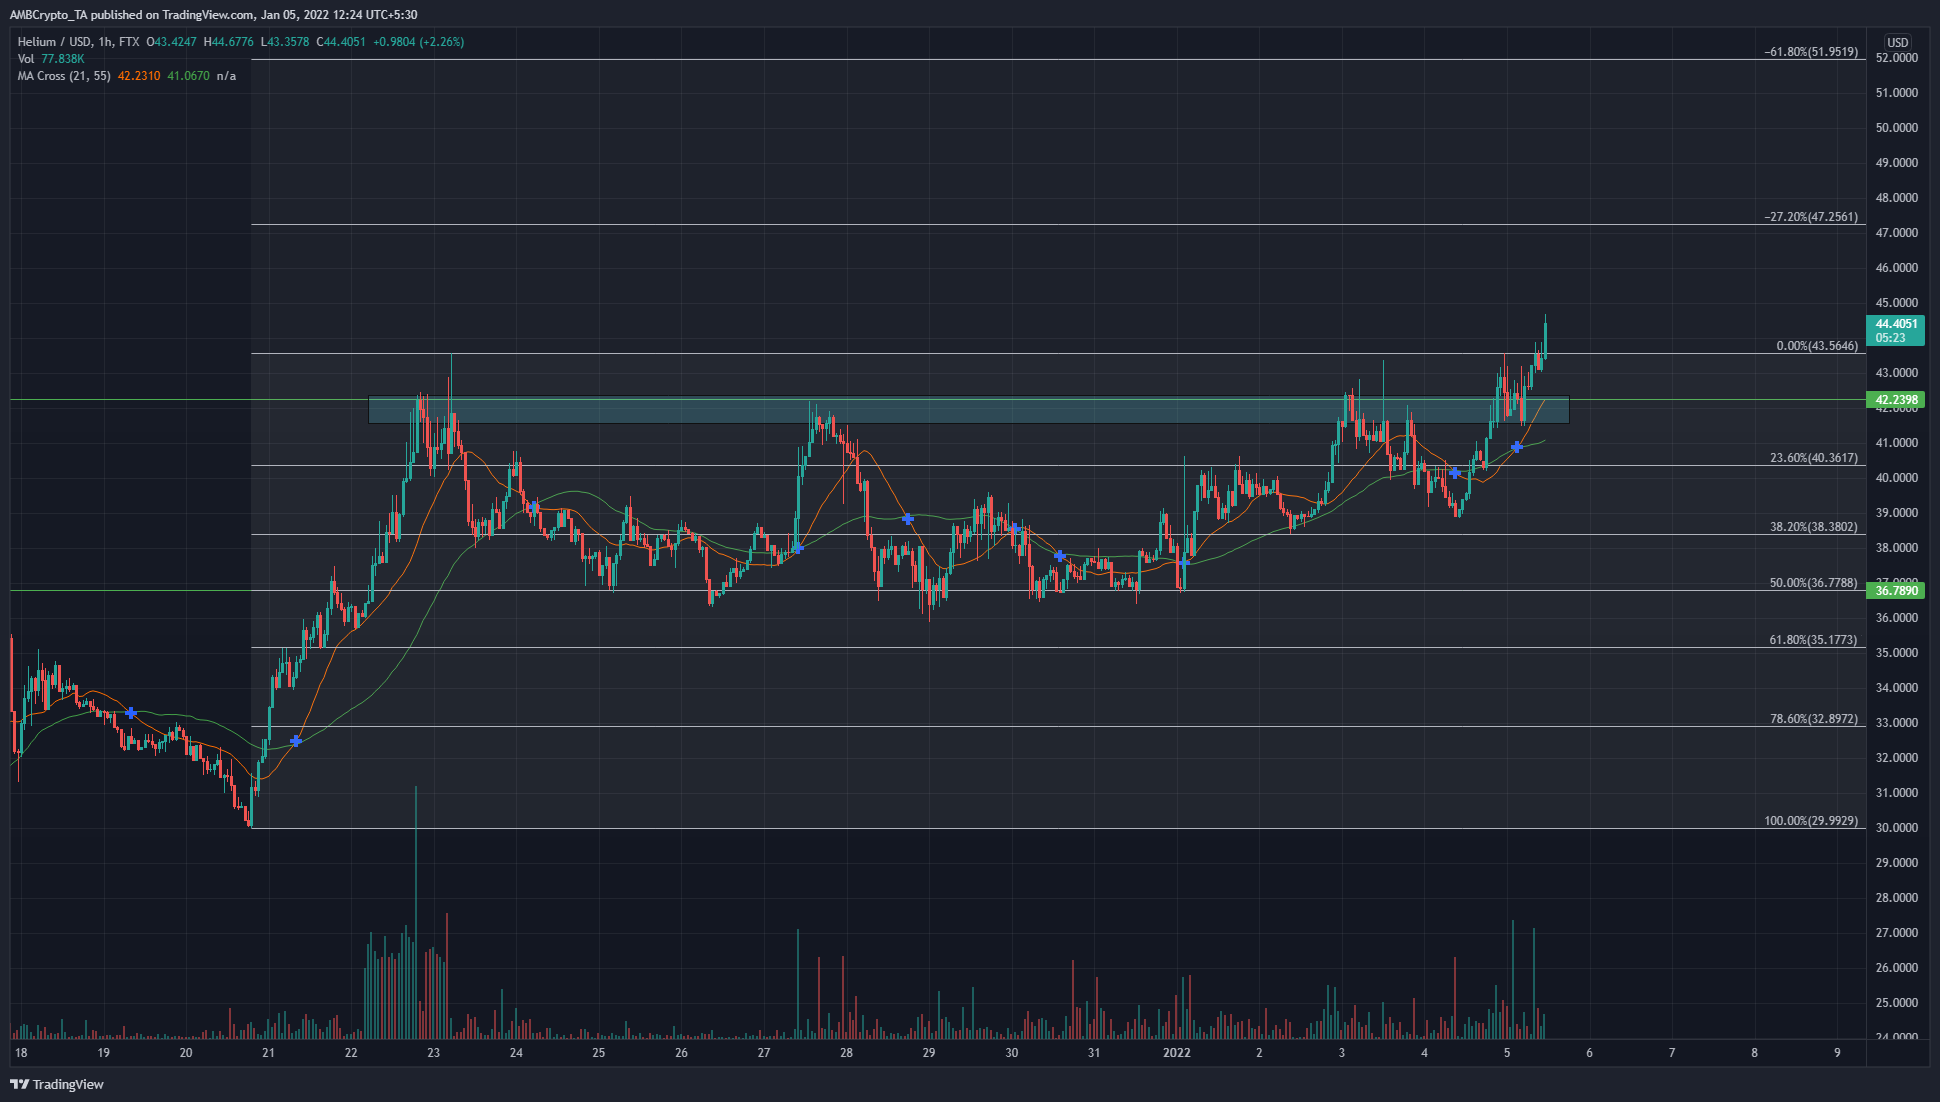
The Fibonacci retracement levels were plotted for Helium’s swing low at $29.9 and swing high at $43.5. Over the past two weeks, HNT appeared to bounce between the highs at $42 and the 50% retracement level support at $36.
This established a range for HNT. Over the past week, HNT has formed higher lows and pushed higher. The bulls succeeded in pushing HNT past the $42.2 mark and retested it in search of buyers.
The trading volume was high on the retest, showing that demand was strong.
The Fibonacci extension levels at 27.2% and 61.8% presented price targets for the bulls and are places where the bullish move would meet some resistance.
Rationale

Source: HNT/USD on TradingView
On the price charts, the 21 SMA (orange) crossed above the 55 SMA (green) meaning recent momentum has been strongly bullish. The RSI was also well above the neutral 50 level, and a value above 60 generally indicates strong bullish momentum as well.
A bearish divergence could be seen if the RSI does not make a higher high while the price does make a higher high. However, this would only see a minor dip and possibly not even take HNT back to the $42.5 area.
Conclusion
On shorter timeframes such as hourly and 4-hour, the price looked strongly bullish. It climbed past a key level at $42.2 and has also been retested to find support. The bears had flipped it to resistance in late November as they aggressively sold off an HNT rally to $54. Now, bulls looked stronger and the price was likely to rise to the $47 resistance area.


