Here is where Ethereum Classic could head in the coming week

Disclaimer: The findings of the following analysis are the sole opinions of the writer and should not be considered investment advice
Ethereum Classic (ETC) steadily withdrew in a descending channel (yellow) for nearly 16 weeks. The 20 EMA (red) assumed a strong resistance until the bulls flipped it to support on 4 February.
From here on, a convincing close above the $32.8-mark would prepare ETC for a retest at the $34.87-level. If the buyers continue to build up pressure at its immediate resistance, a retest near its three-month Point of Control (red) would be likely before a slight pullback. At press time, ETC was trading at $32.63, up by 5.1% in the last 24 hours.
ETC Daily Chart
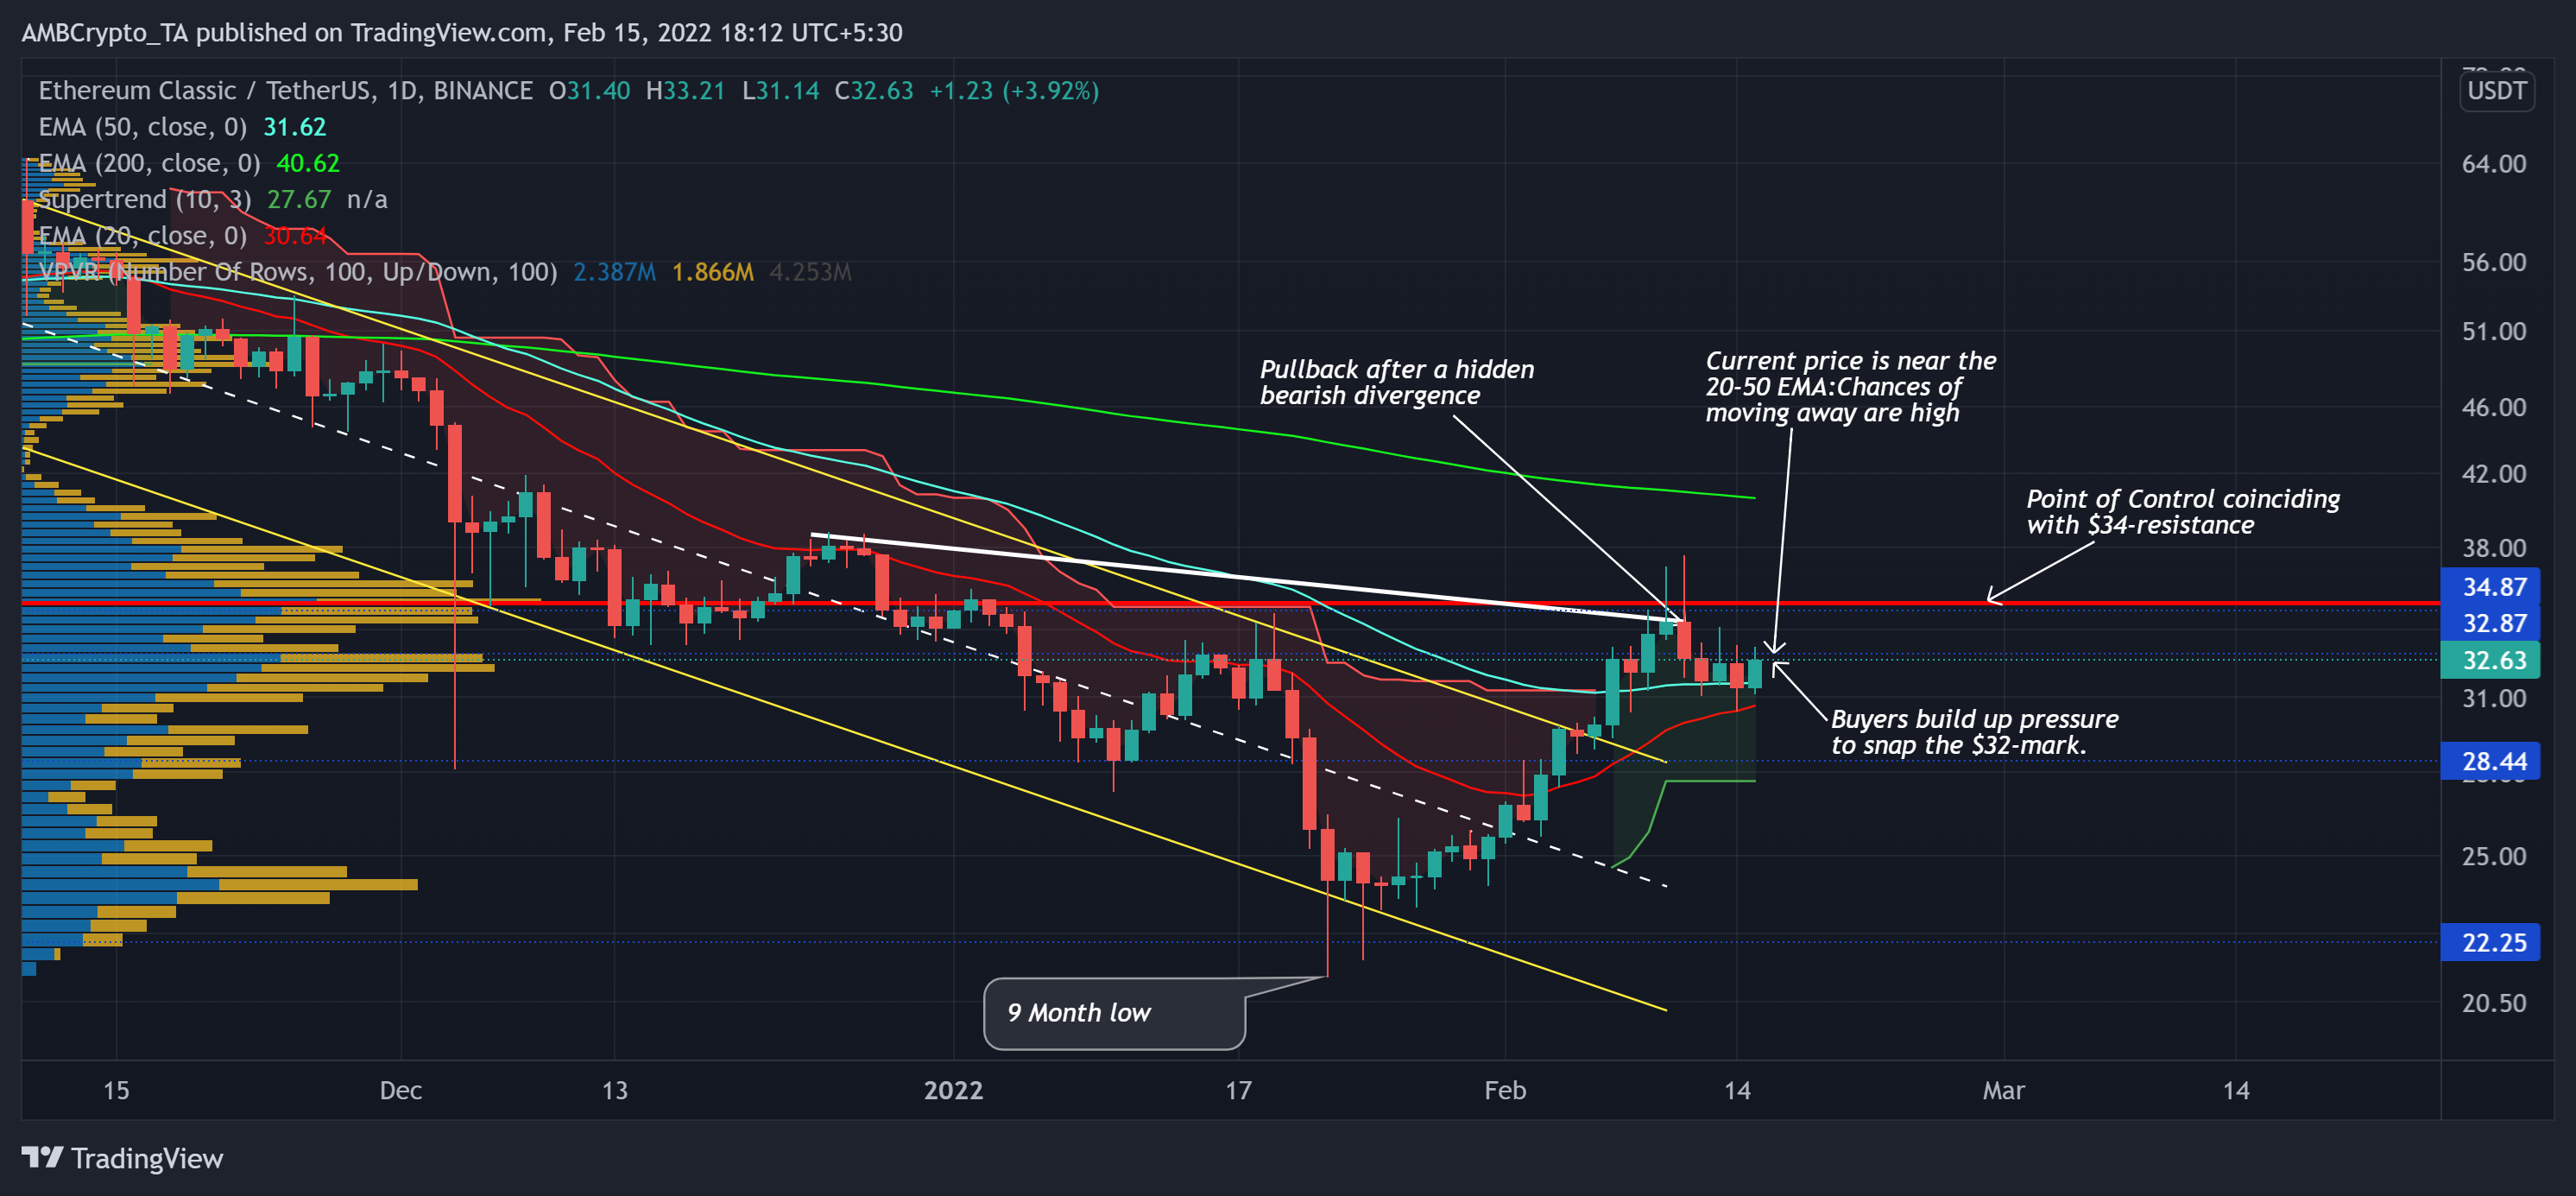
The down-channel retracement saw a nearly 66.9% fall as it snapped off multiple price points. For instance, the bears flipped the $35-mark Point of Control from support to resistance.
However, ETC noted an over 74% ROI from its nine-month low on 22 January as it flipped the 50 EMA to its immediate support. But, it struggled to topple the $34-mark as it formed a bearish divergence (white trendline) with its RSI.
Now, the buyers exerted sustained pressure and have tested the $32-mark resistance twice in the last three days. This level has offered the highest liquidity after its three-month Point of Control. Thus, making it difficult for the bulls to initiate a swift recovery. Any close above this level would propel a $34-retest. Should the buyers lose their vigor, the 50 EMA would provide testing support in the near term.
Rationale
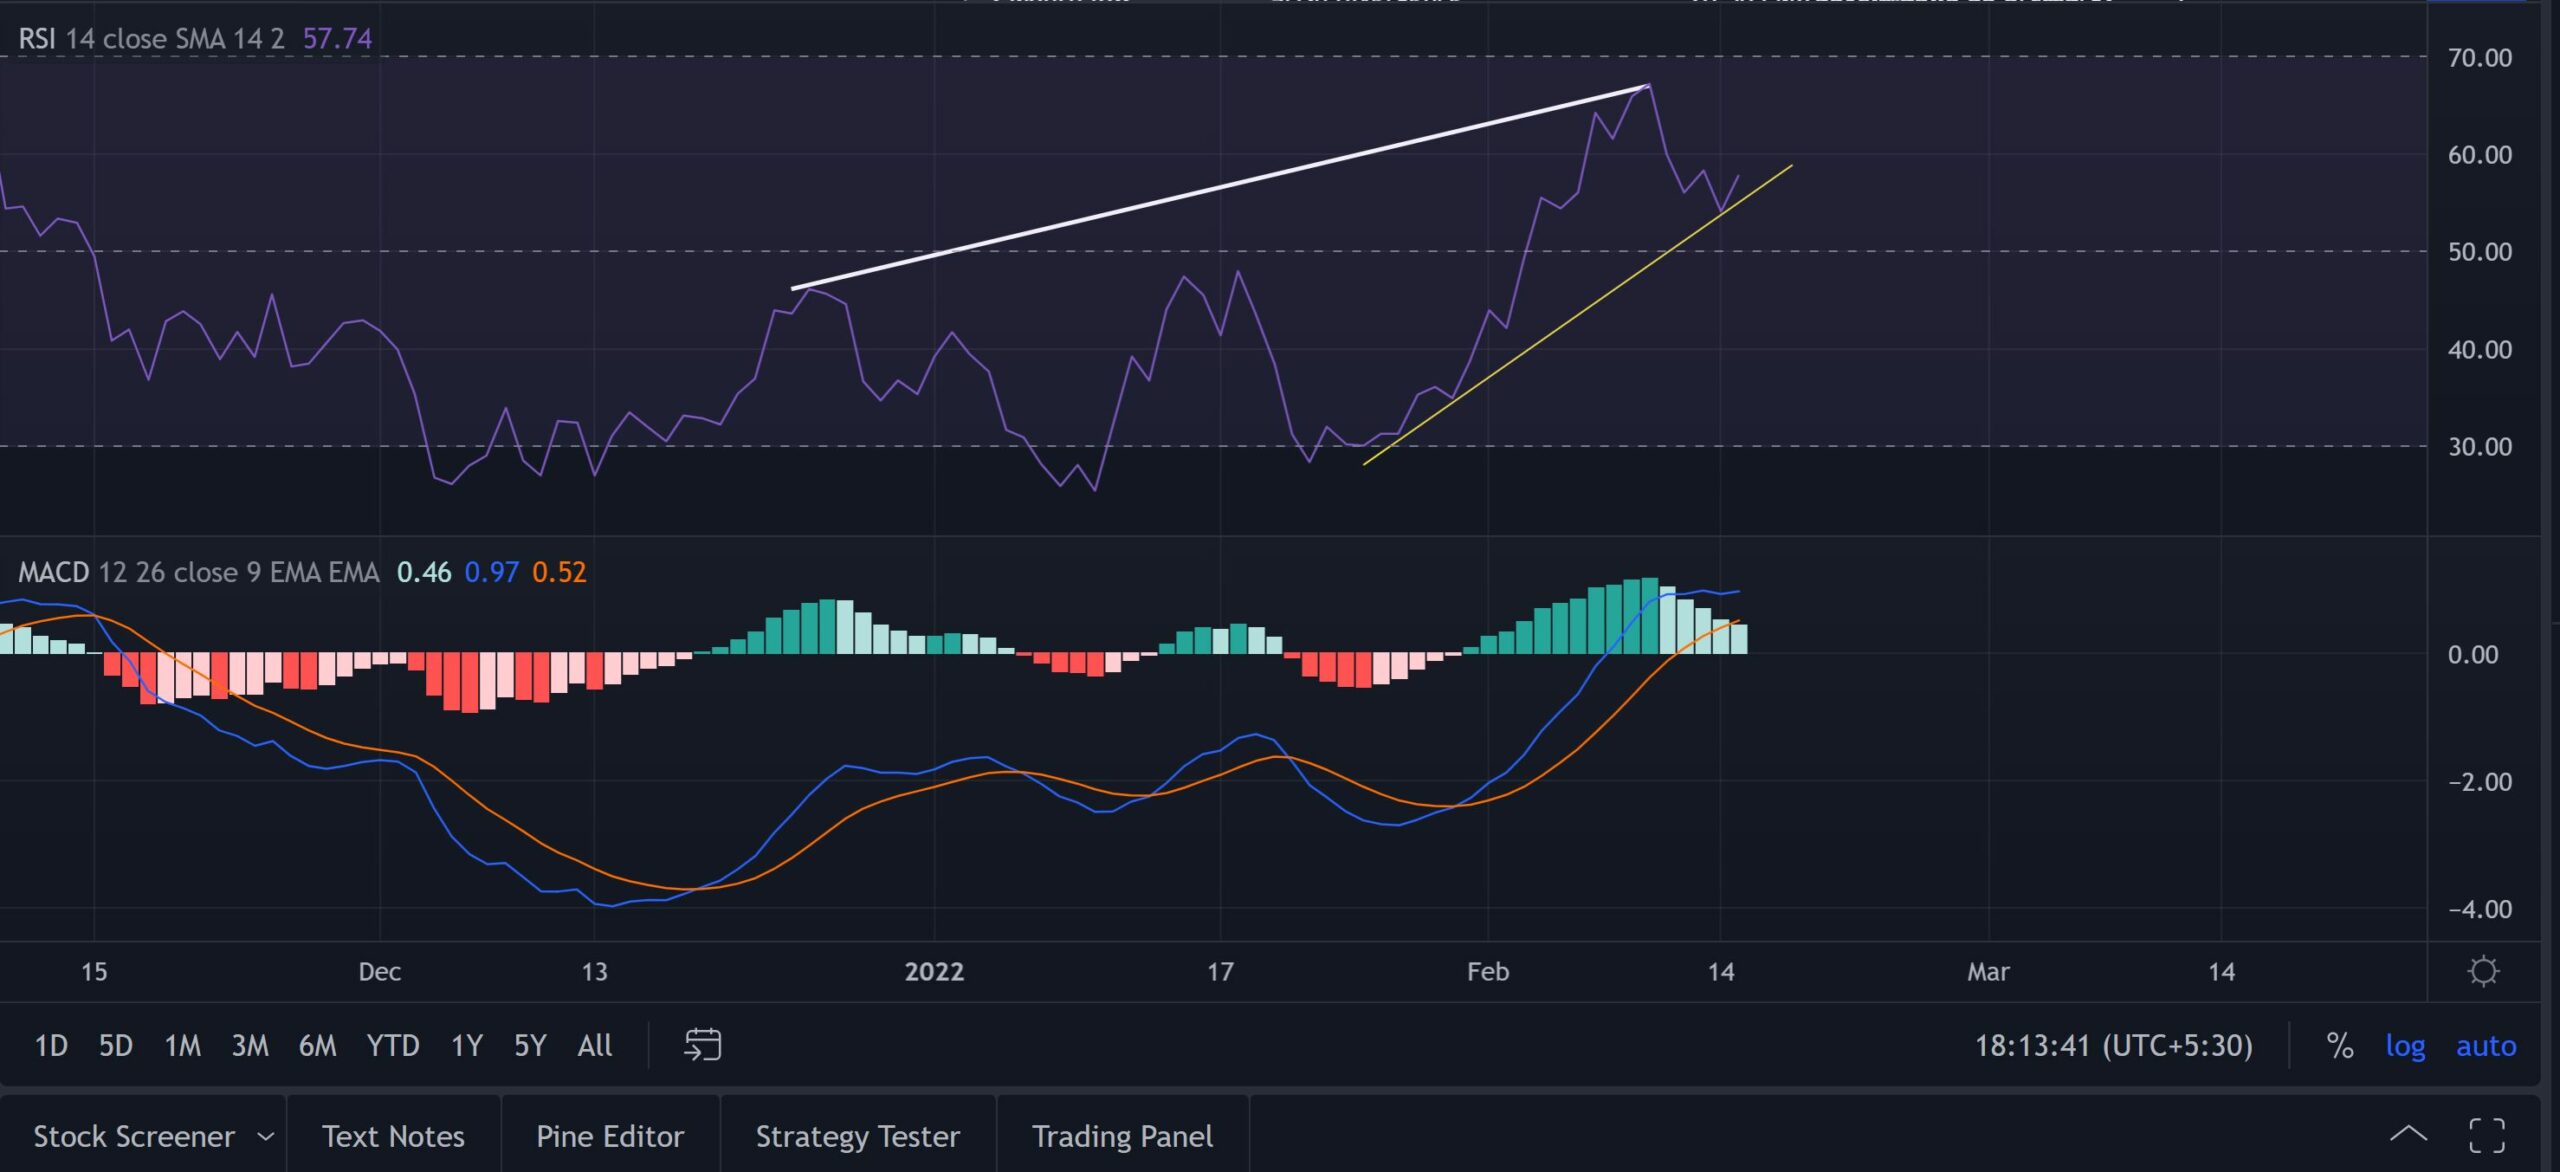
The RSI has maintained itself above the half-line and showed healthy revival signs after the bearish divergence. It respected the bullish trendline support (yellow) in its upward trajectory. Also, the Supertrend finally entered into a green zone after nearly 11 weeks. If the MACD enters into a tight phase, a further clash between the buyers and sellers at this level could be expected.
Conclusion
So far, ETC has depicted a healthy reversal as it sustained above the 20 EMA for the past 11 days. Also, the current trading price was near its EMA’s, hinting at higher chances of a movement in the current trend.
Considering the confluence between these factors and a possible close above the $32-level resistance, a retest of the $35-zone could be conceivable. Besides, the broader market sentiment and the on-chain developments would play a vital role in influencing future movements.


