Here’s how Ethereum can reclaim $3,600

Ethereum’s rise to crypto dominance has been a much-discussed topic off-late. Recently, Nvidia CEO Jensen Huang joined a long list of proponents that perceive a strong future for the world’s largest altcoin. Ballparks have been set around $10,000 at the end of 2021 even after factoring in the recent crypto sell-off. Even though ETH traded around $2,600 at press time, its long-term outlook was indeed optimistic.
Ethereum 12-hour chart
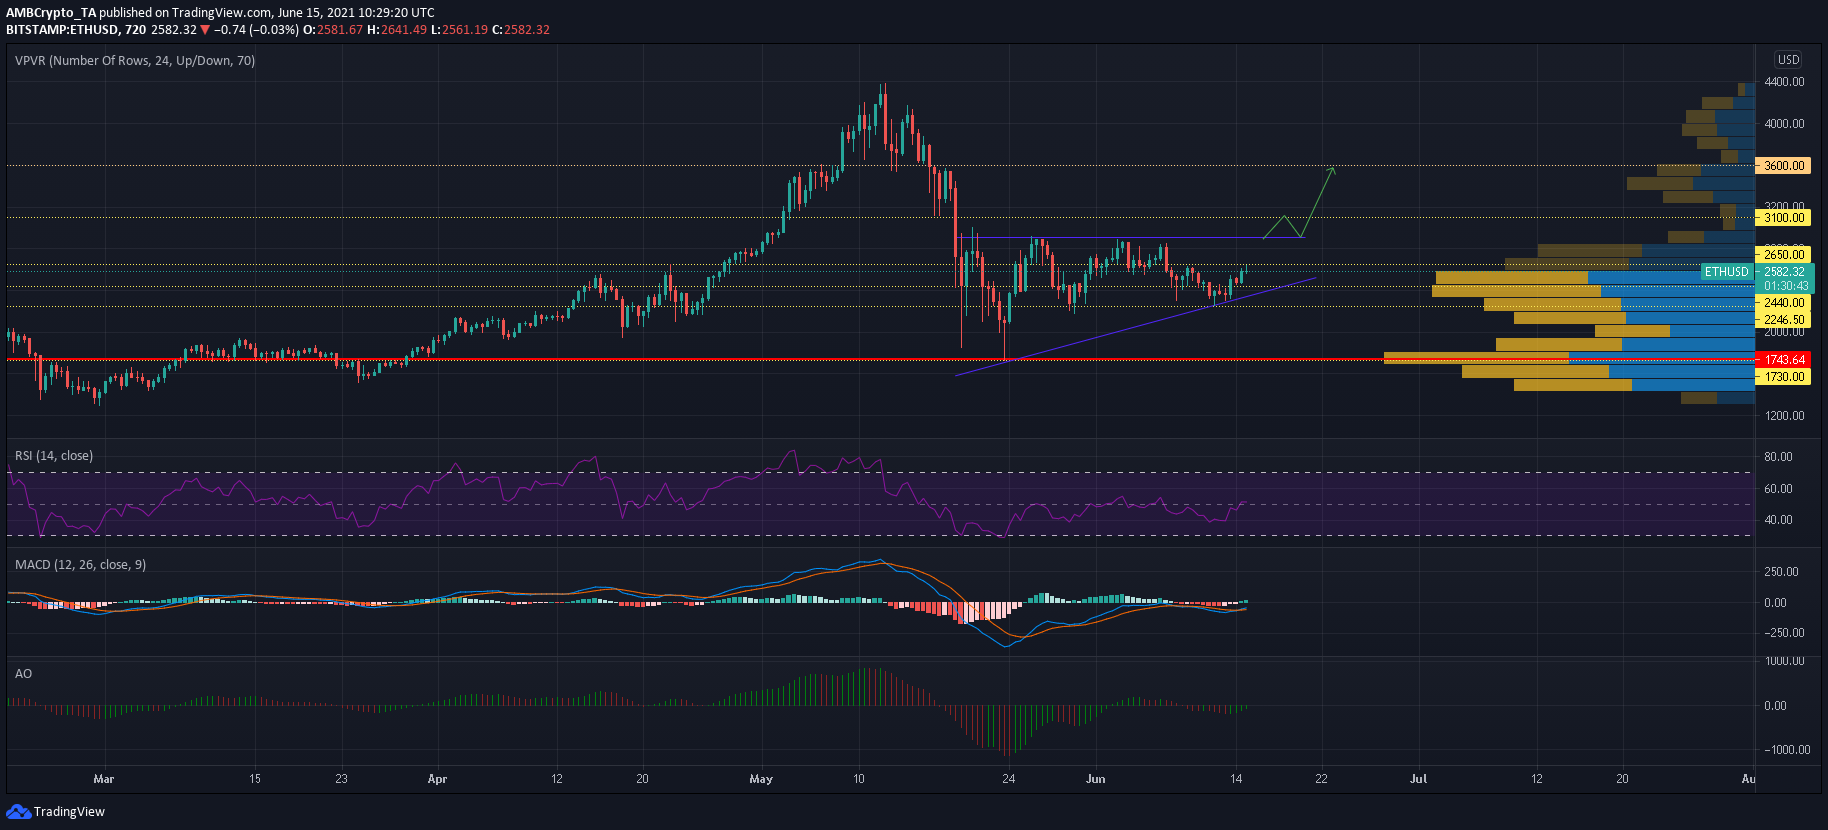
Since the 19th May crash, Ethereum has tested $2,900 on multiple occasions but a breakout has been denied on each attempt. This has led to regular downtrends in the market. The most recent one occurred between 7-13th June and saw ETH shed 20% of its value from $2,800 to $2,200.However, the cryptocurrency has managed to find support at higher levels post correctional periods. Hence, an ascending triangle formed in the process with the upper trendline representing a rigid ceiling at $2,900.
Reasoning
Relative Strength Index traded in neutral territory at the time of writing but its projected movement was extremely significant. The index has been denied a break above 55-60 since 19th May as bears have been in control. If RSI breaks above this barrier over the coming days, we could see a shift in market dynamics. A bullish crossover was noted in MACD as it prepared to rise above the half-line. Awesome Oscillator suggested that momentum was slowly shifting over to the buyers. These were encouraging signs as ETH prepared for its next swing at $2,900.
The first challenge lay in the form of $2,650 resistance and another one at $2,900. Visible Range showed high trading activity in these regions- something that could work against a favorable outcome. However, not much resistance lay above $2,900. If bulls prevail, a breakout above the pattern could see ETH test $3,100, and successfully clearing this range could see a rise towards mid-May levels of $3,600. Overall, the jump would represent gains of 24% from the upper trendline of the pattern.
Conclusion
As Ethereum approached its next leg towards $2,900, a break was expected to the upside. The RSI, in particular, should be observed over the coming days as it could give a sense of market direction. A successful breakout from ETH’s ascending triangle could see it retake the $3,600-level over the coming days.