Here’s how MANA’s price could respond to the current market sentiment

After the sellers provoked a high volatility break below the $1.9-level in late April, Decentraland (MANA) saw a series of consistent troughs alongside lower peaks on its chart. The three-week trendline resistance offered a strong selling point for constricting the bull runs over the last month.
A robust close below the $1.2-resistance would position MANA to head into a tight phase near its high liquidity range represented by its Point of Control (POC, red). At press time, MANA traded at $1.2161, down by 2.21%in the last 24 hours.
MANA 4-hour Chart
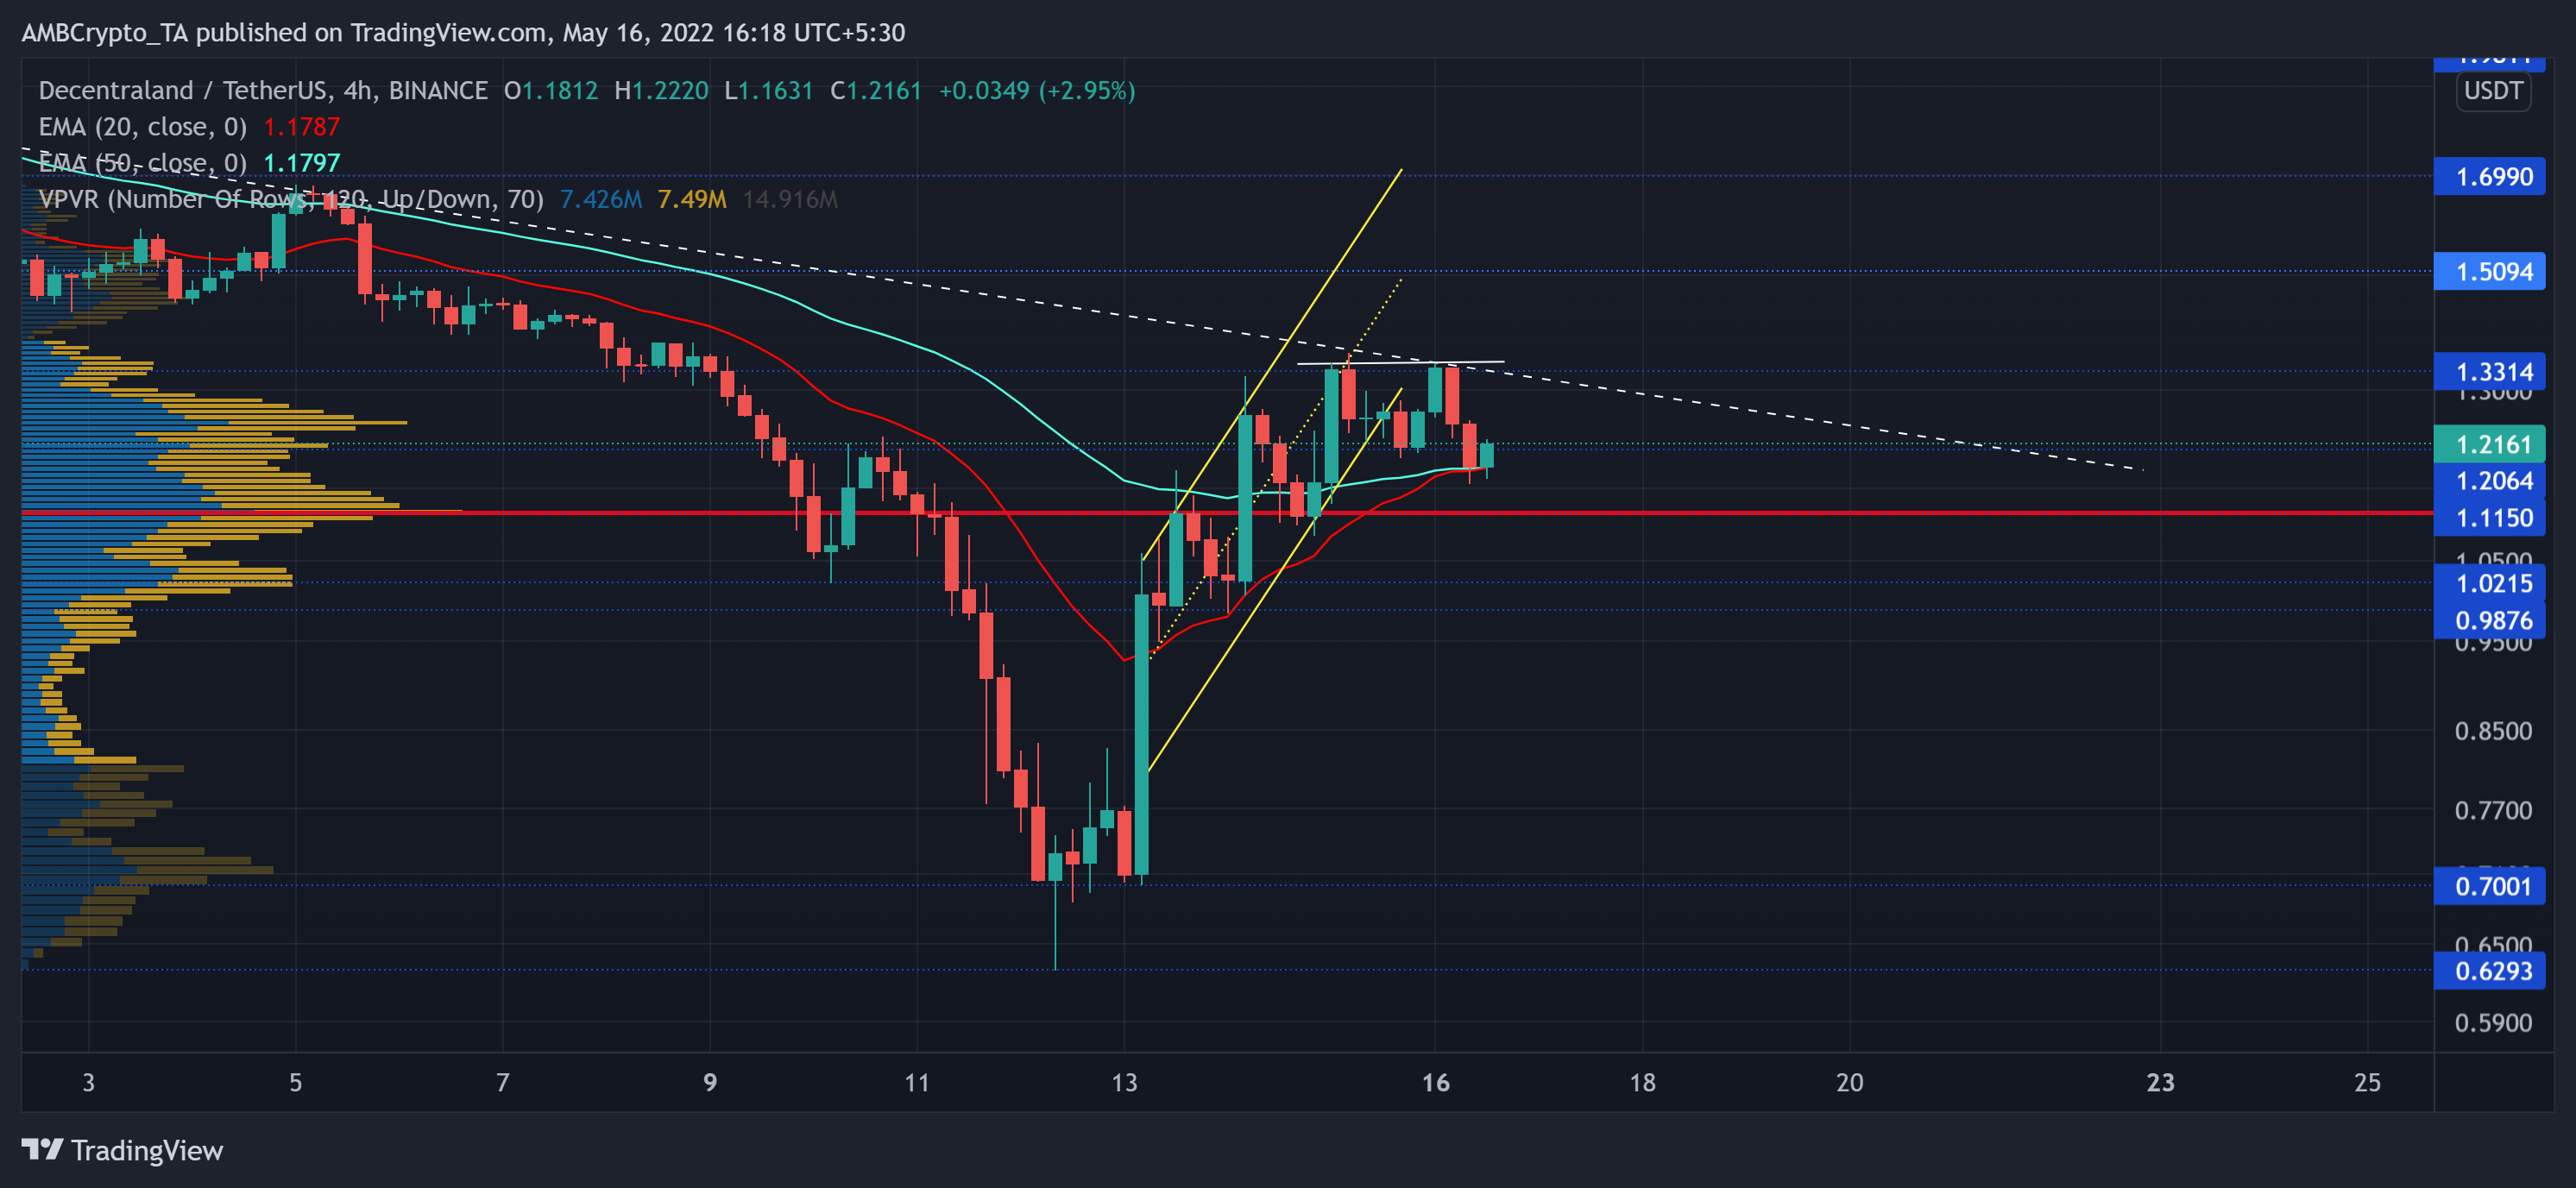
After slipping from its ATH, MANA found a traversing range between $1.7 to $3.3 for nearly three months. But with the selling pressure mounting up on the $1.7-floor, sellers were quick to inflict a steep drop toward the $0.6-$0.7 range. The immediate trendline resistance has supported the bearish narrative by keeping the bull rallies on a leash.
Consequently, the altcoin took a plunge to poke its seven-month low on 12 May. However, over the last five days, MANA ascended in an up-channel (yellow) on its four-hour chart. After breaking down from the $1.3-zone, the price may enter into a squeeze phase in the coming sessions. A plausible bullish crossover of the 20 EMA (red) and 50 EMA (cyan) would help the buyers gain some thrust to challenge the bonds of the trendline resistance.
A compelling close above the $1.2-level coupled with a 20/50 EMA bullish crossover would pave a path for a recovery above the $1.3-zone. But an inability to maintain the current levels would pull MANA toward its POC before any trend committal move.
Rationale
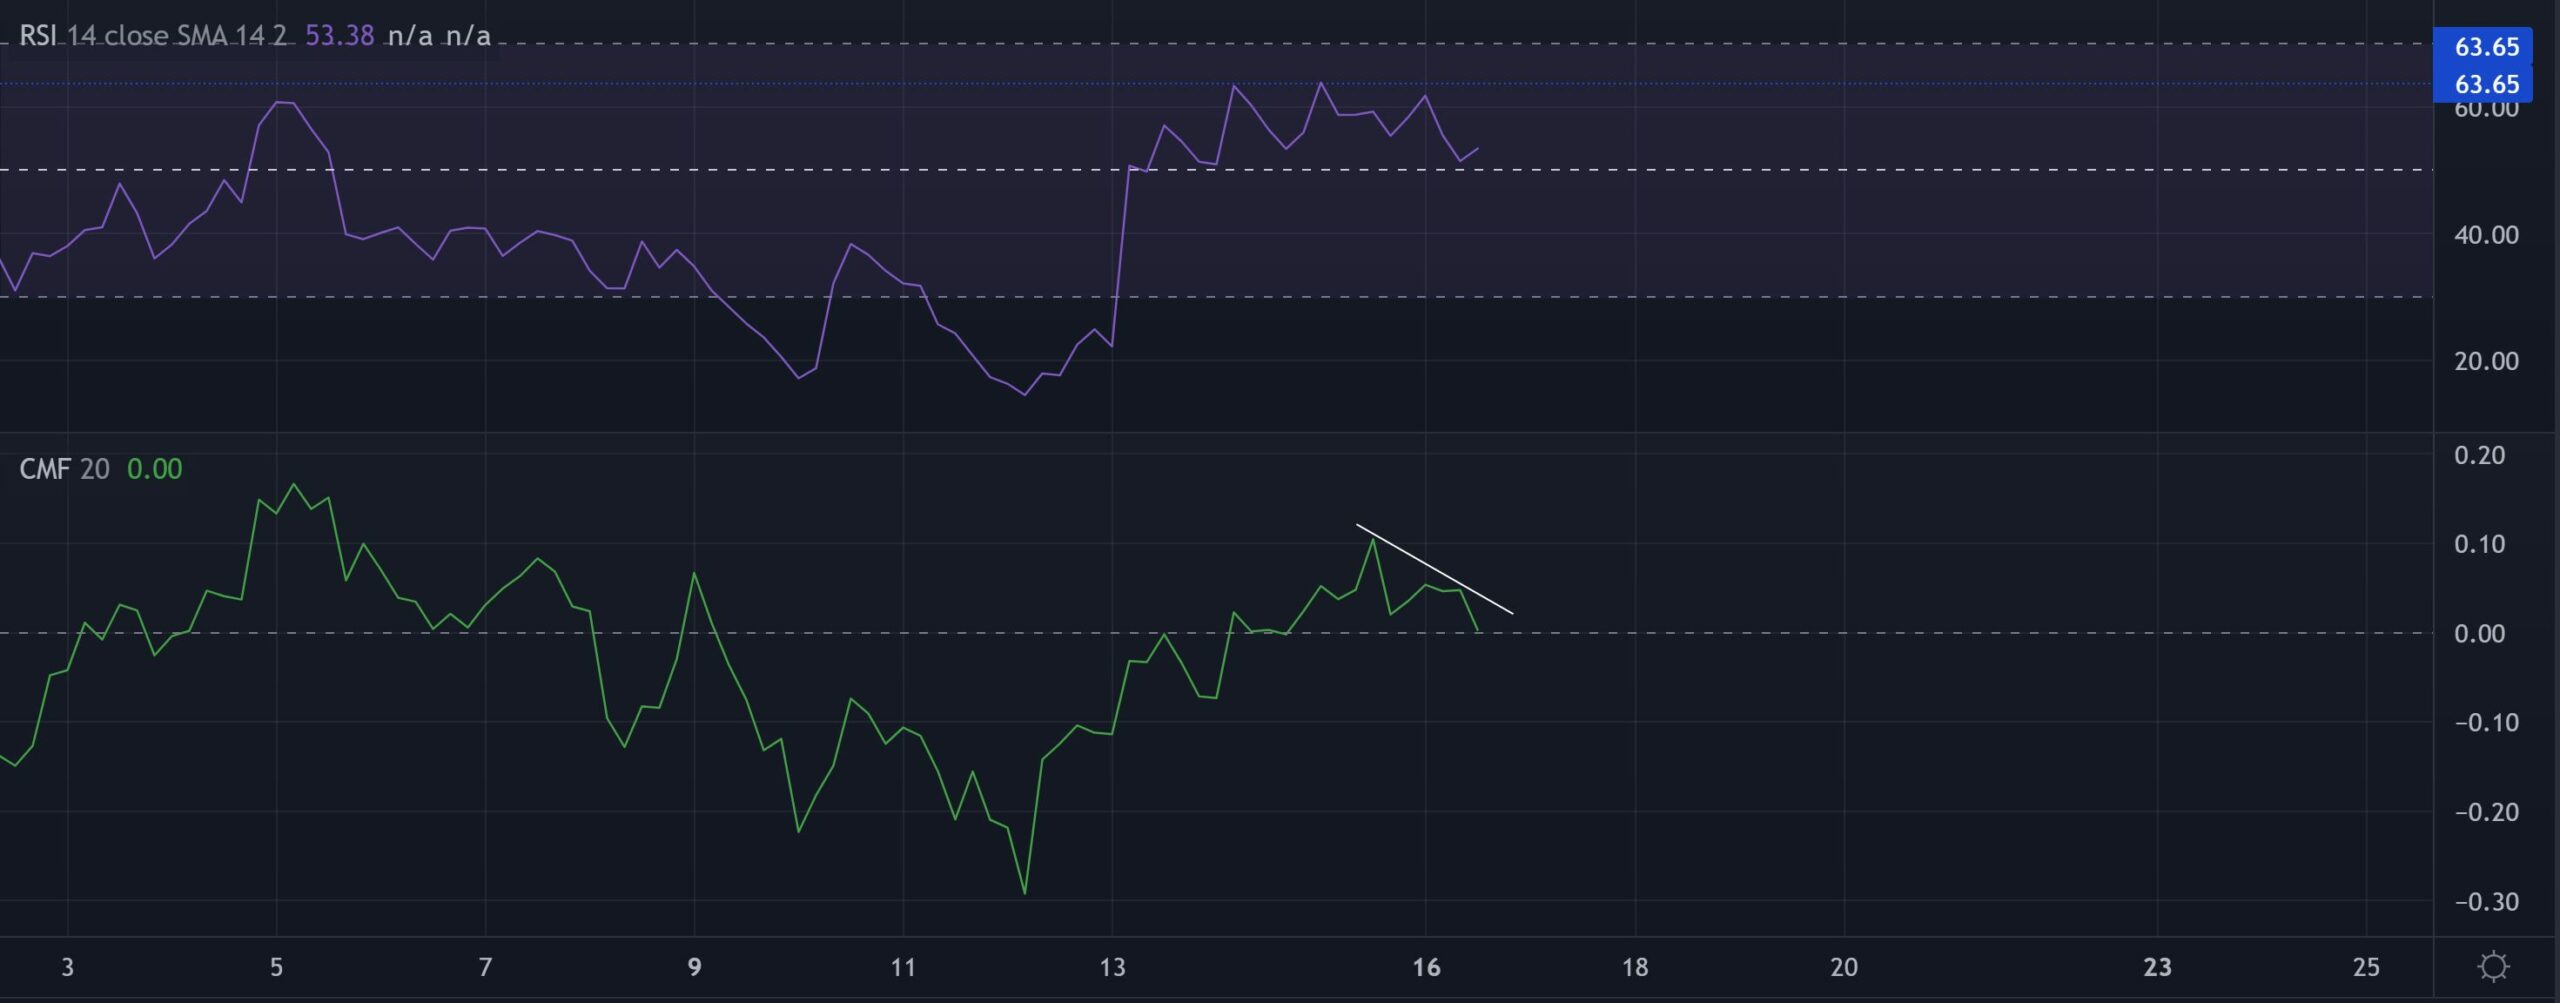
The alt’s Relative Strength Index managed to sustain itself above the mid-line while testing the 63-mark resistance. A continued compression phase above the midline could help buyers regain a slight edge on the charts.
On the other hand, the CMF marked a bearish divergence with the price as it fell toward its zero-mark. A sustained close below this mark could delay the potential recovery prospects for MANA.
Conclusion
Should the price close above the 20/50 EMA alongside the $1.2-mark, buyers would claim a slight edge in the short-term trend. In which case, the $1.3-zone would be critical for them to topple to open doorways for a potential bull run. But looking at the weak buying volumes, MANA could see itself swaying near the POC before making a vigorous move on either side.
Finally, the alt shares a whopping 90% 30-day correlation with Bitcoin. So, keeping a watch on the king coin’s movement would be useful to make a profitable bet.


