Here’s what might temper MATIC buyers’ expectations this week

Disclaimer: The findings of the following analysis are the sole opinions of the writer and should not be considered investment advice.
- MATIC’s golden cross on the daily chart reignited the chances of a trend reversal
- The crypto’s social dominance declined whilst its Open Interest unveiled a bullish edge
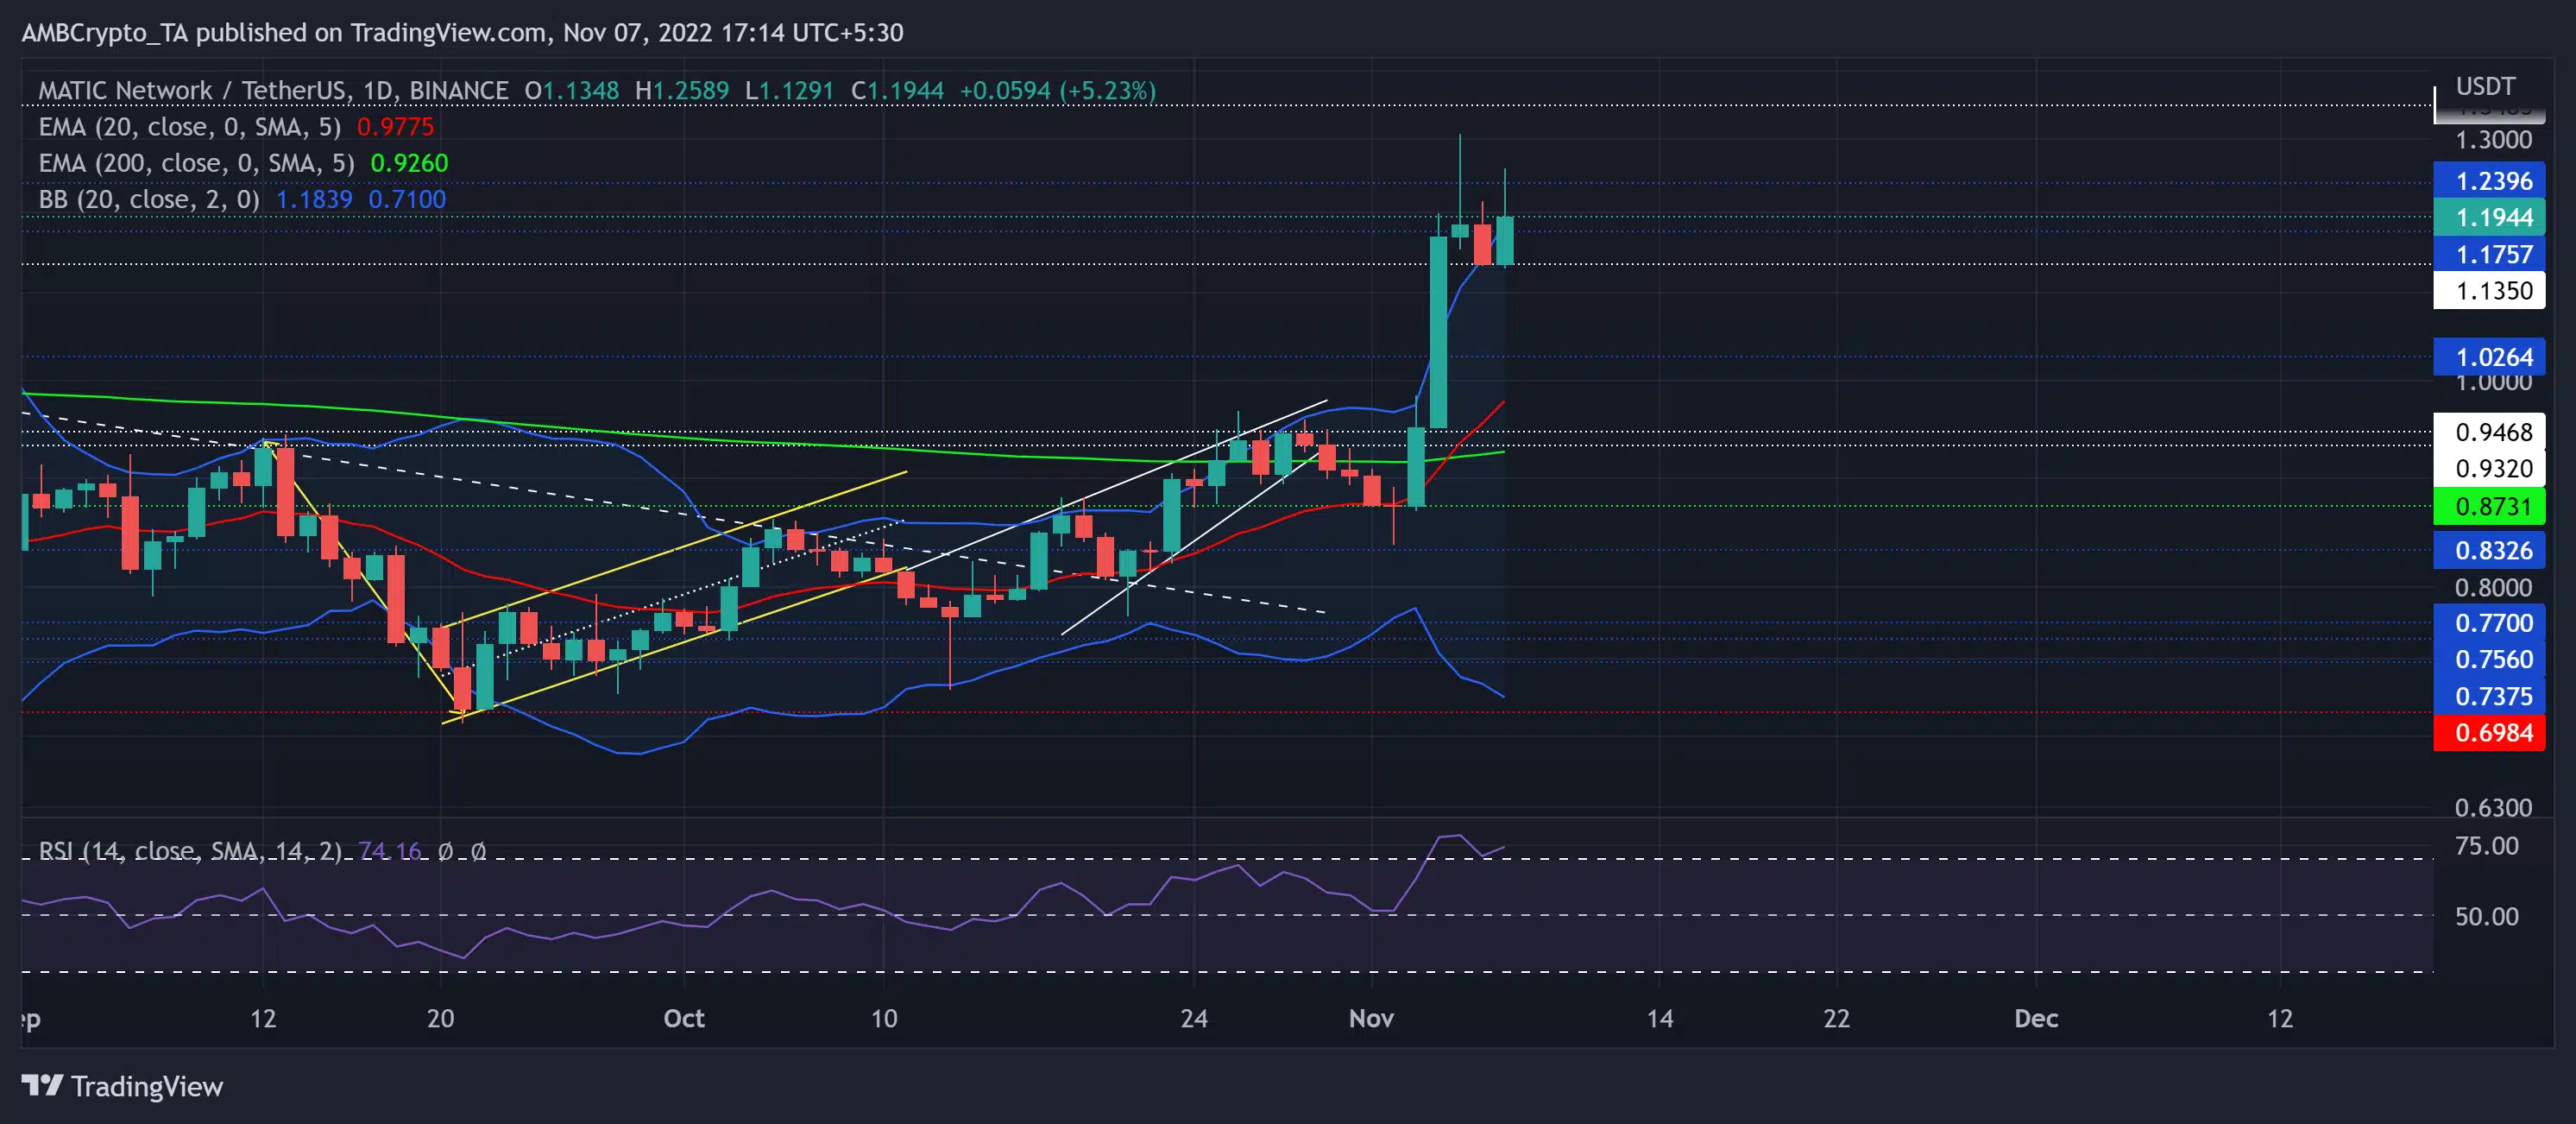
Recent buying efforts pushed Polygon [MATIC] again towards the upper band of the Bollinger Bands (BB) as it found solid buying pressure to test its $1.2-resistance.
Here’s AMBCrypto’s price prediction for Polygon [MATIC] for 2023-24
After slightly slowing down at this resistance range, MATIC flashed mixed signals on its chart. The sellers could seek to curb the string of green candles to overturn the extended bull run.
At press time, MATIC was trading at $1.1944, up by 4.39% in the last 24 hours.
The token broke into high volatility
Since breaking above the nine-month trendline support (white, dashed), MATIC has been on a quest to find fresher highs. As a result, the rising wedge breakdown too was undermined by the 20 EMA (red) and the $0.87-baseline.
MATIC’s solid double-digit growth in the last four days aided the alt in retesting the $1.1-$1.2 resistance range near the upper band of the BB. With the 20 EMA crossing above the 200 EMA, the buyers reaffirmed their long-term bullish intentions.
Any decline from the immediate resistance could find resting grounds at the $1.02-level followed by the 20 EMA (red) in the $0.94-$0.97 range. A potential/ immediate recovery from this support could present buying opportunities.
The first major resistance level would continue to be in the $1.2-zone. Any close above this barrier could fetch impressive gains while pushing MATIC toward the $1.4-zone.
The Relative Strength Index (RSI) stood in the overbought region while projecting a one-sided bullish edge. A plausible decline below the 70-mark in the coming sessions could ease the buying pressure.
Decreased Social Dominance alongside a spike in Open Interest
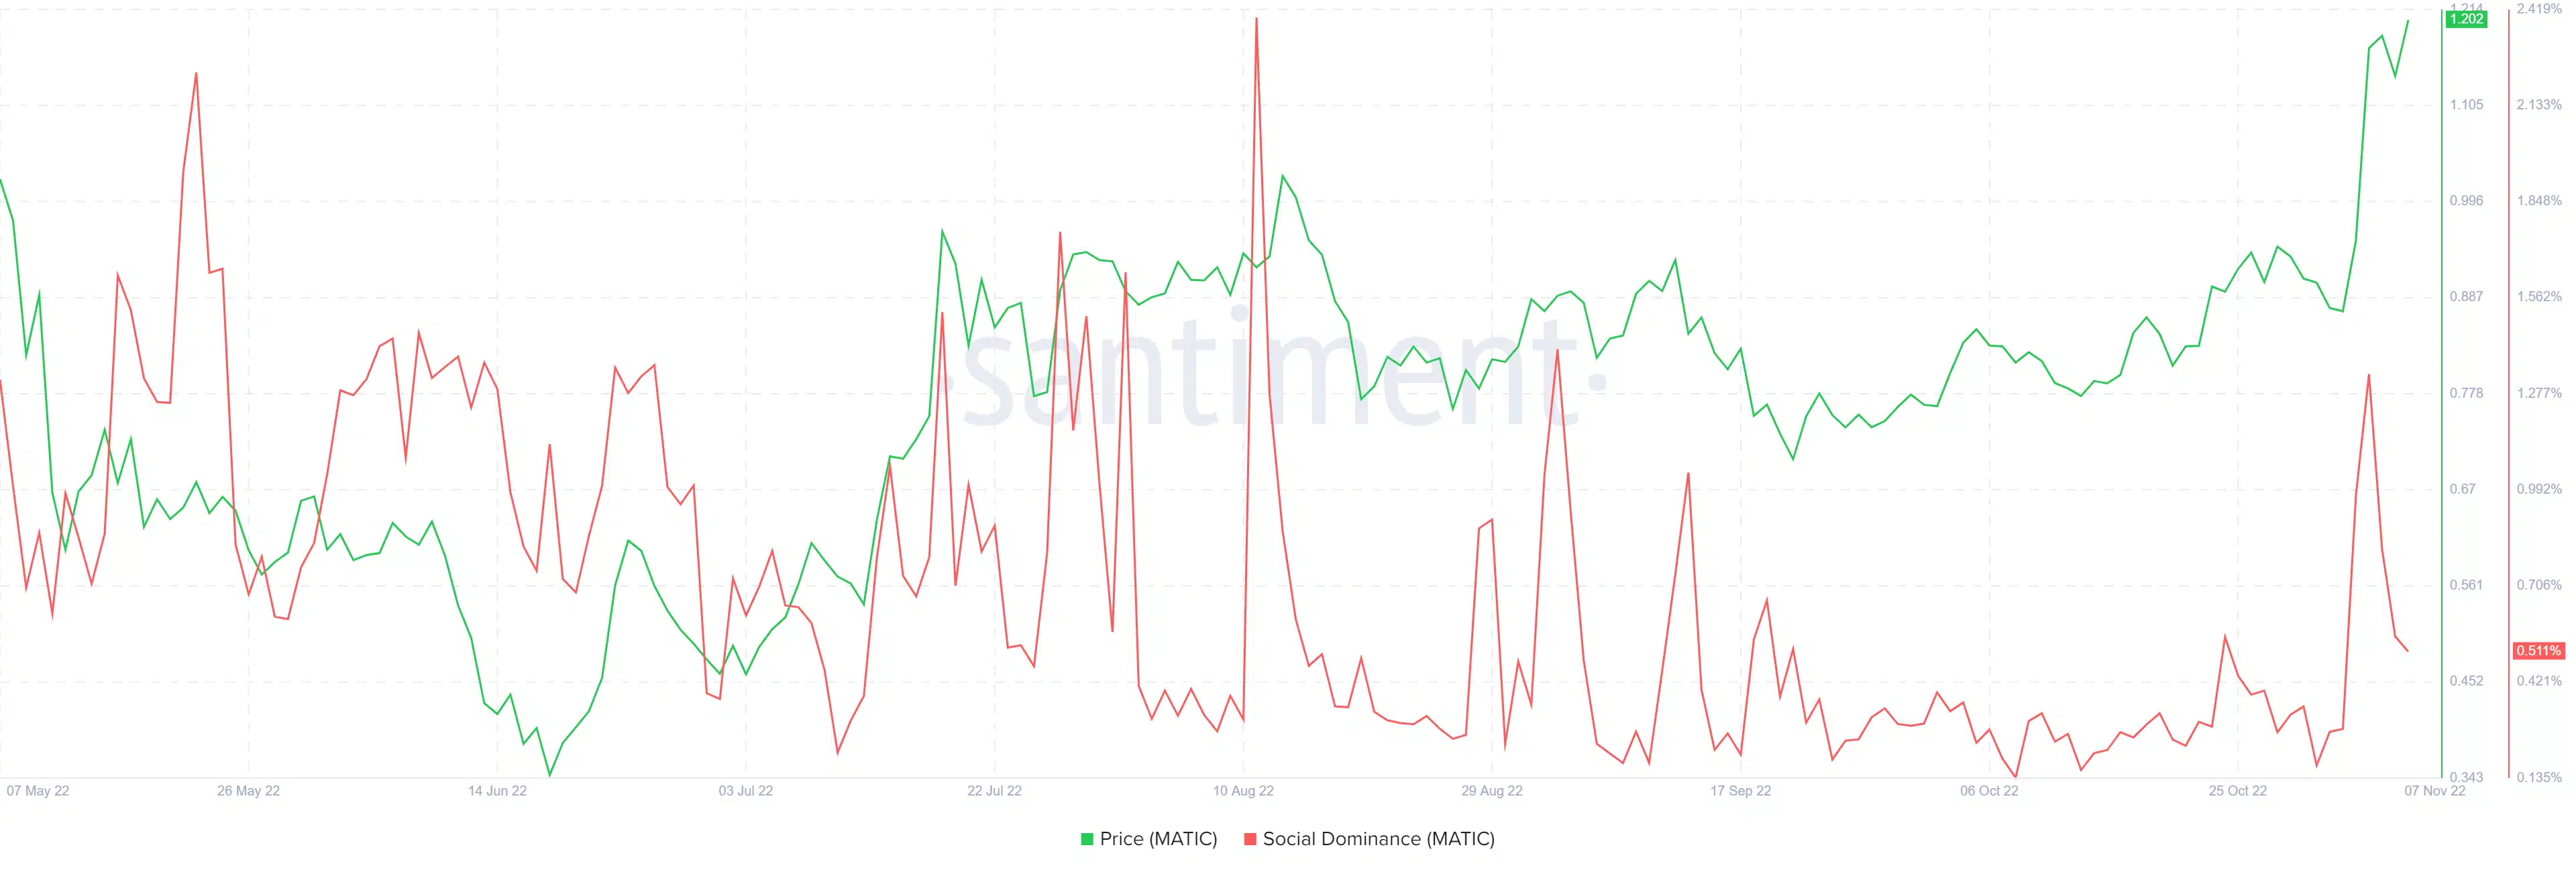
Since mid-August, MATIC’s social dominance has seen a consistent decline on its charts. The metric saw a significant pull in the last four days while the price action diverged to register slight gains. The buyers should consider the possibility of a corresponding price dip, especially given the altcoin’s sensitivity to the metric.
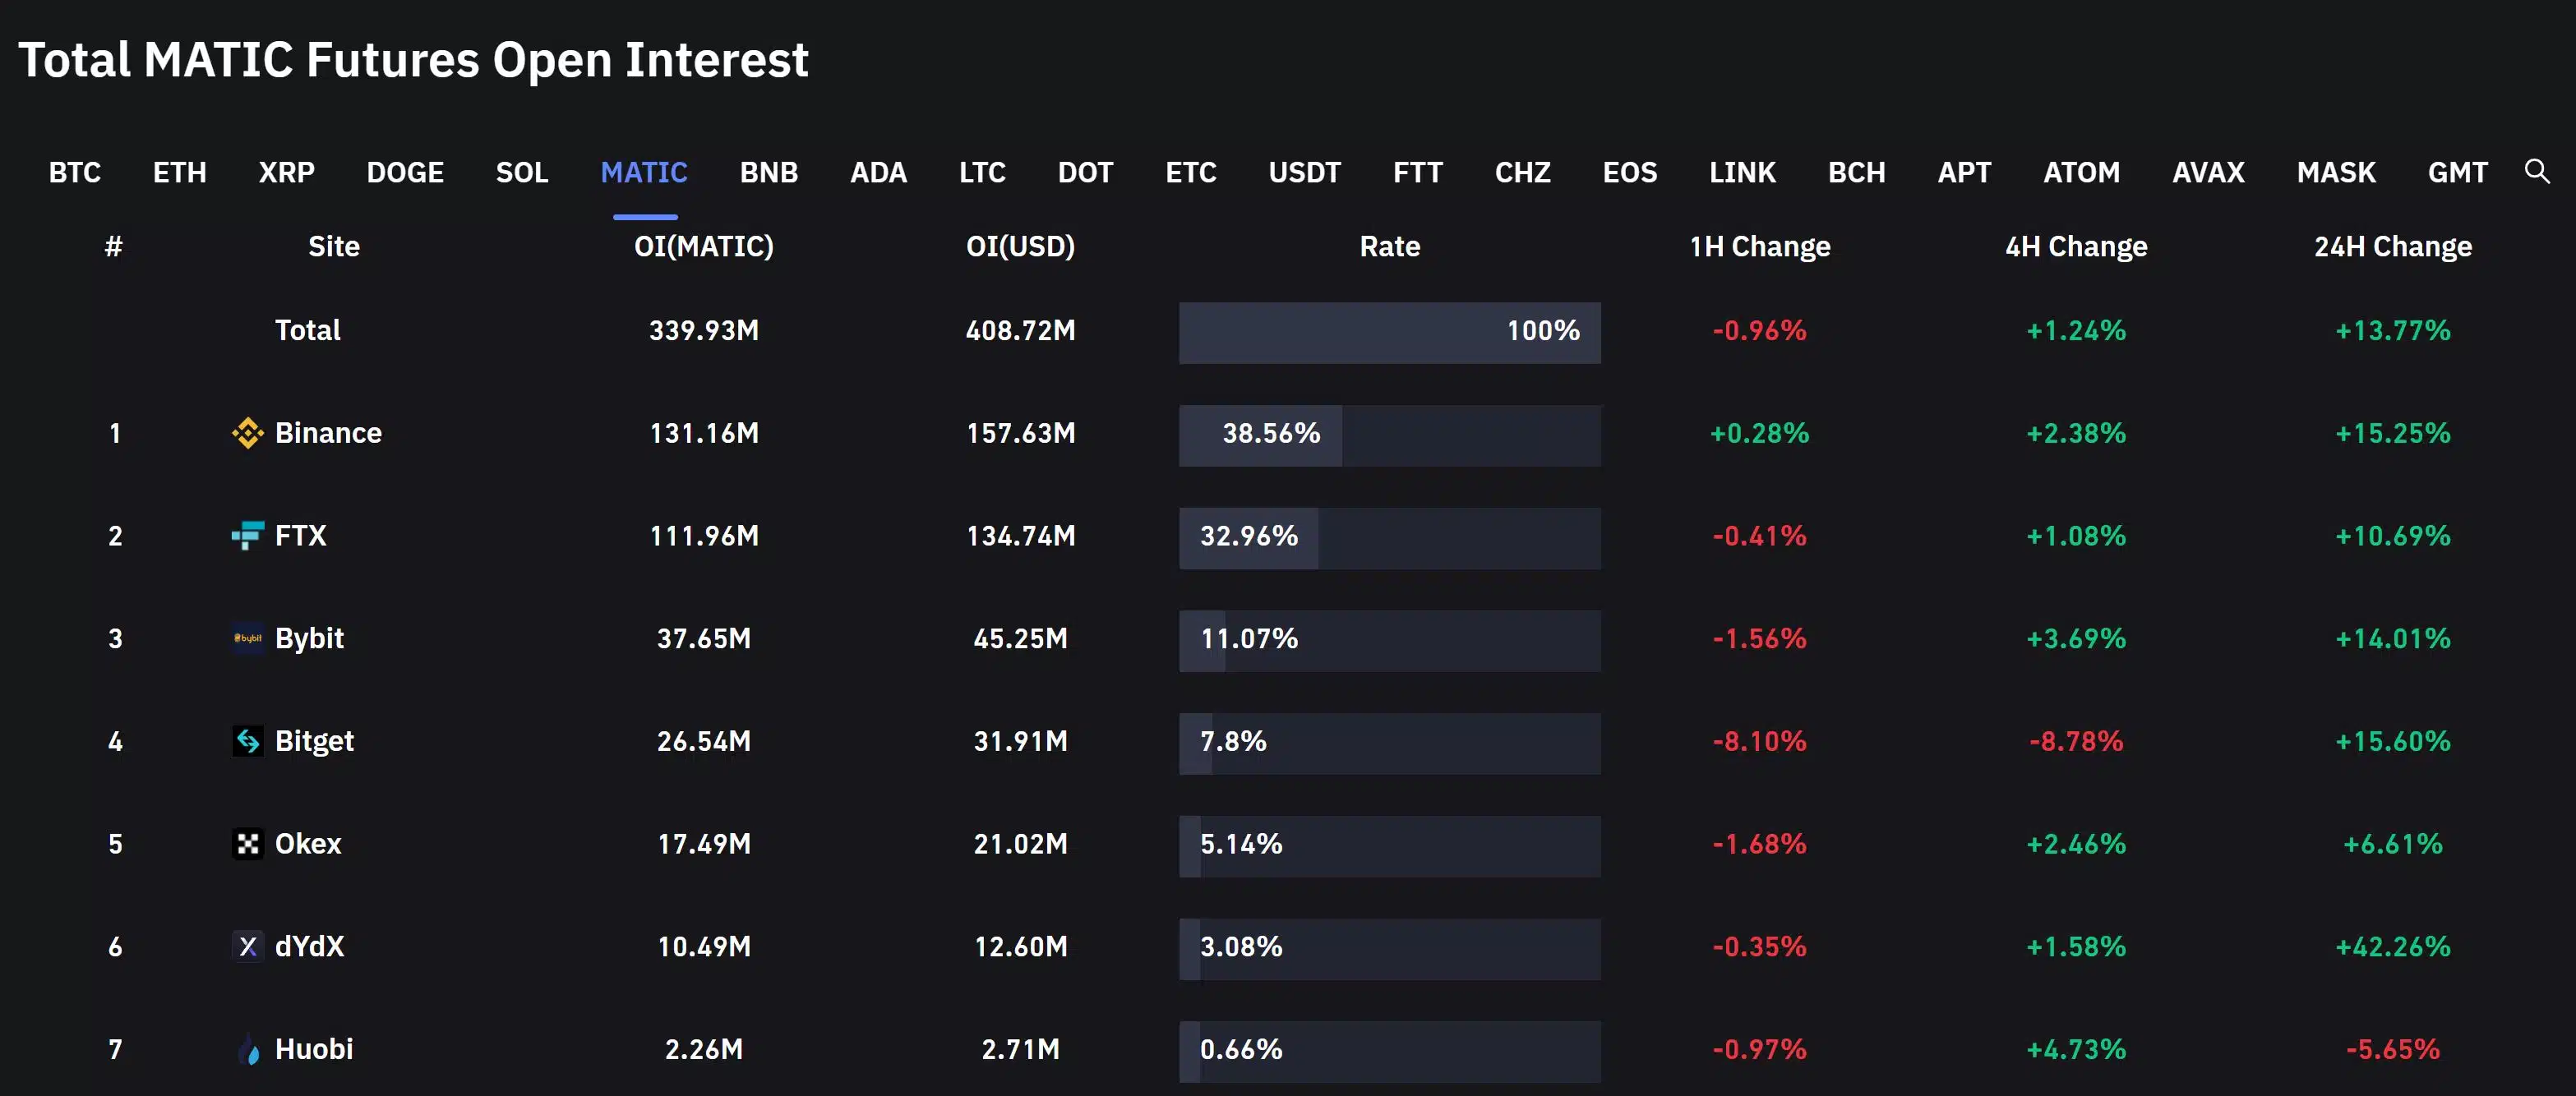
Nonetheless, the total MATIC Futures interest across all exchanges saw a nearly 13.7% incline over the last 24 hours. The price action marked an over 4% hike during the same time. These readings highlighted positive investor sentiment in the Futures market.
Finally, investors/traders must keep a close eye on Bitcoin’s movement as MATIC shares a relatively high correlation with the king coin.


