Analysis
Here’s what SAND traders can expect after this pattern break
SAND bears took after as it fell below key support levels, will the bulls step in?
- SAND recently found strong support as bulls aimed to provoke a break above its current pattern.
- Derivates data showed a bearish edge, with some hopes for a bullish revival.
With the bears provoking another liquidation rally in The Sandbox’s [SAND] market, the price action struggled to stay above crucial support levels.
The rebound from the 50 EMA invoked a downtrend toward the $0.23 support at press time.
The bulls would now aim to break the bearish edge, especially as the price approached a high liquidity zone. At the time of writing, SAND traded at nearly $0.24, up by nearly 5% over the past day.
Can bulls step in to stop the bleeding?
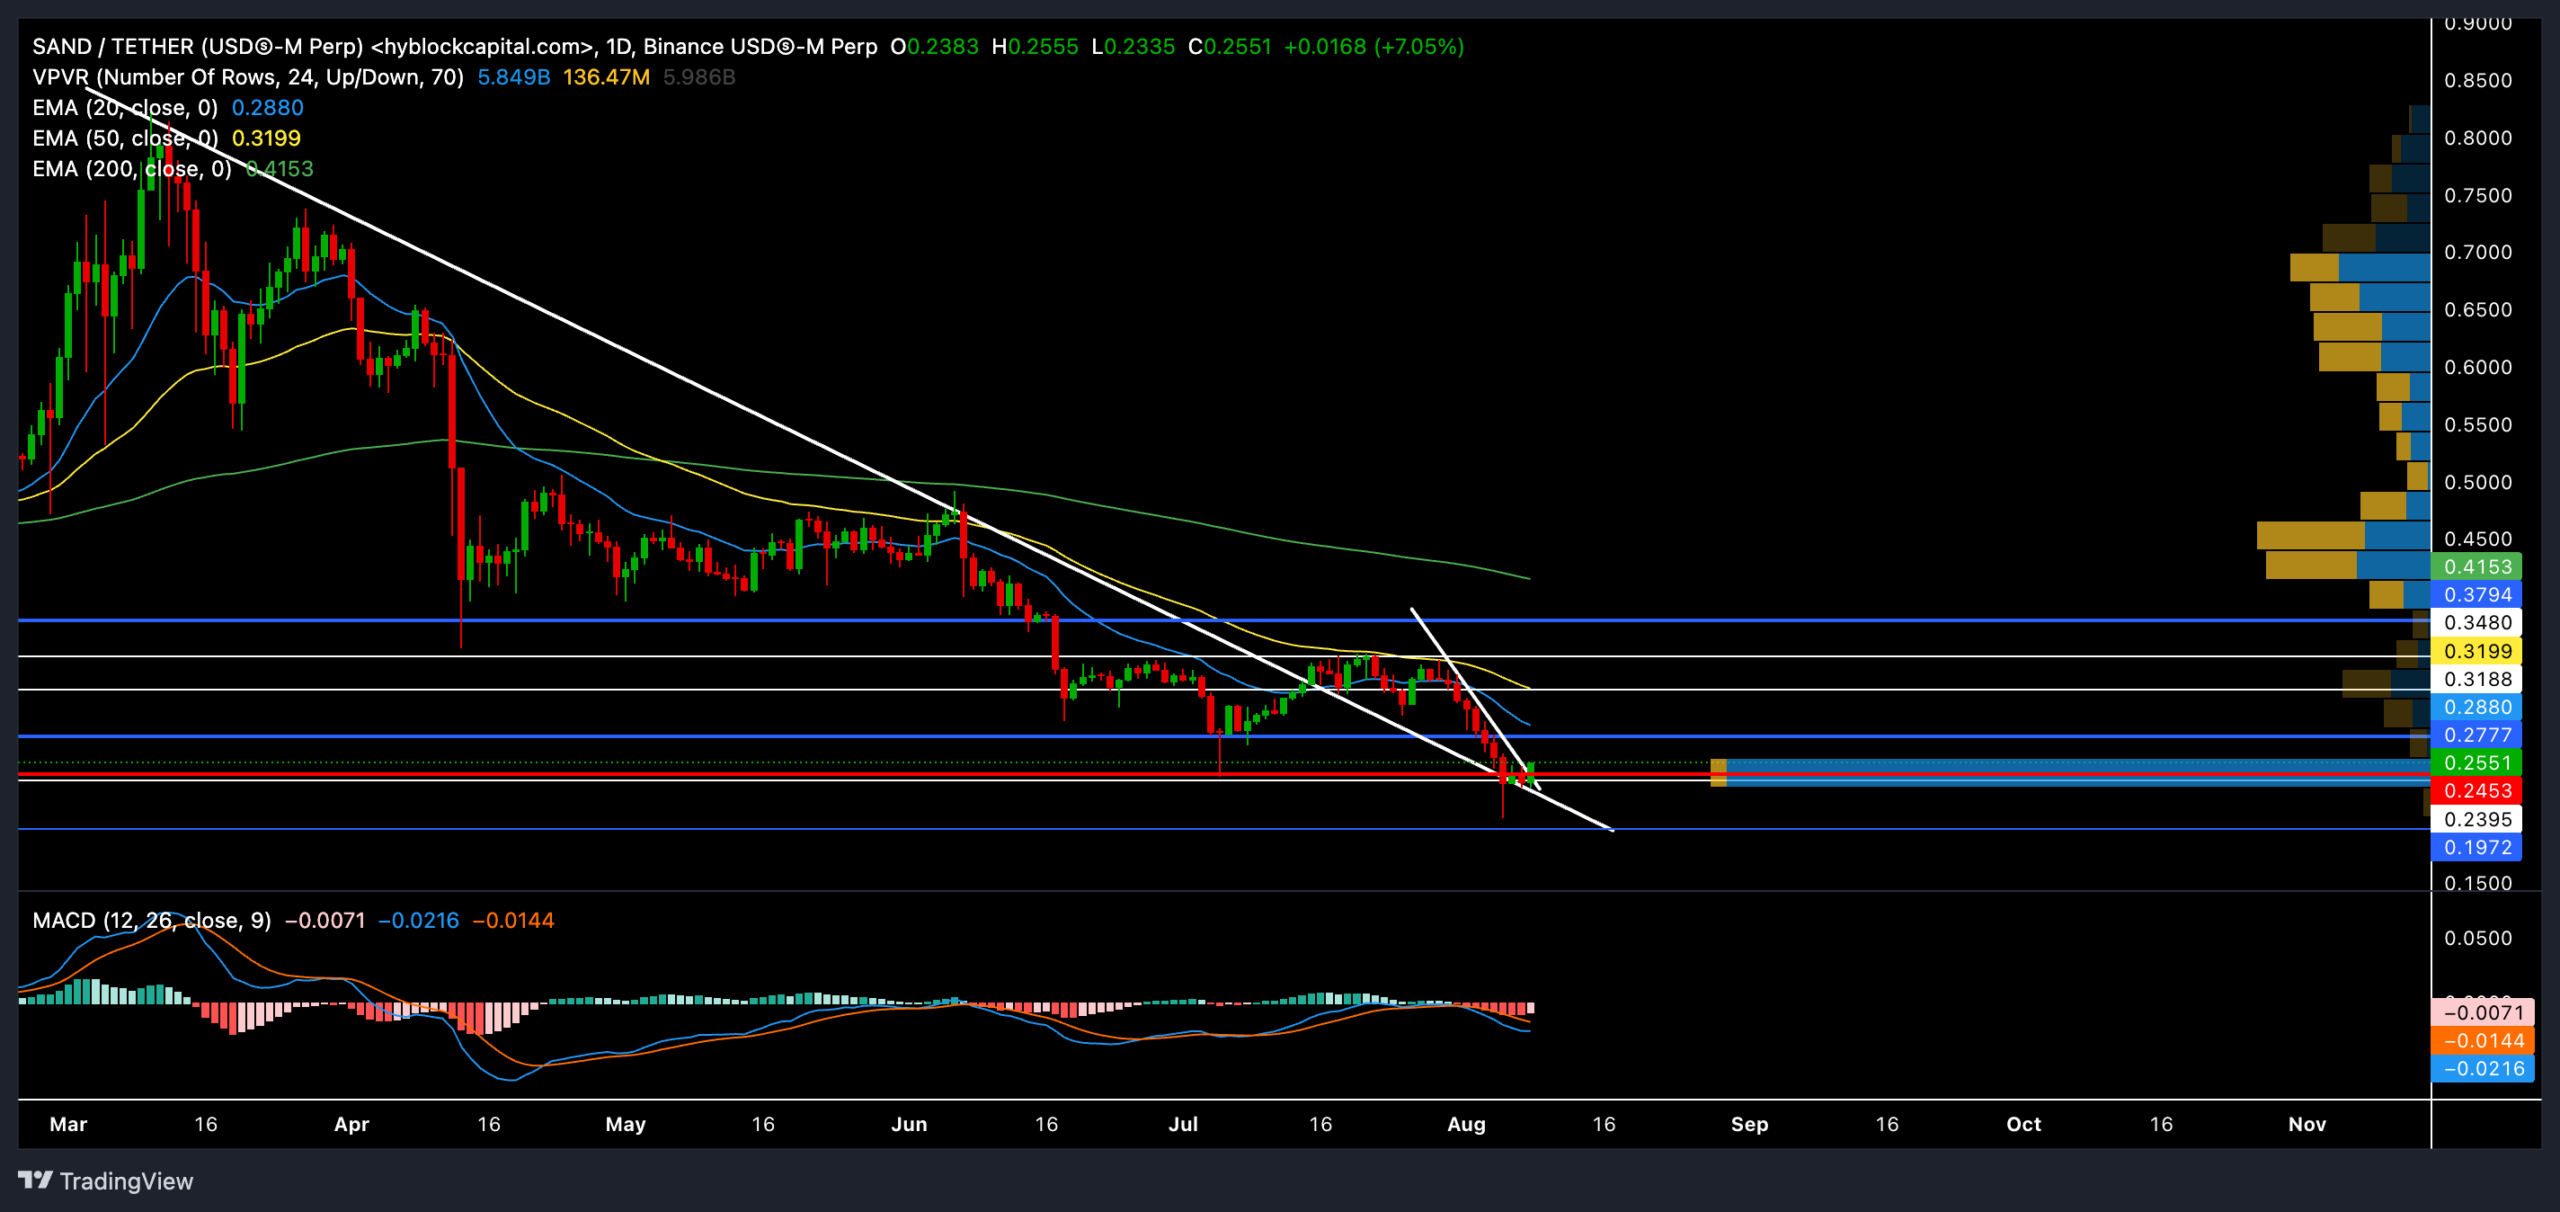
Source: TradingView, SAND/USDT
SAND bears found renewed power after rebounding from its 200-day EMA (green) in early June. On its way down, the price action also fell below the 20-day and 50-day EMAs to reflect a strong bearish edge.
Here, it’s worth noting that the 200-day EMA coincided with the then-trendline resistance (white), which provoked some bearish pressure.
The resulting downtrend resulted in a nearly 49% decline in just two months. However, the $0.23 level support has reignited some bullish revival hopes at the time of writing.
In the meantime, SAND found a close above its long-term trendline resistance and flipped it to support its daily chart.
The altcoin has also formed a classic falling wedge pattern. The recent bullish rebound from $0.23 support can set the stage for bulls to break out of this pattern.
Should the bulls find a strong close above the current pattern, SAND could find a way to test the $0.28-$0.31 resistance range before any bearish reversal.
On the other hand, should the price action decline below the immediate support level at the $0.23 mark, the altcoin could see an extended decline before rebounding.
The MACD lines reaffirmed the overall bearish edge in the SAND market. However, buyers should keep an eye out for a potential bullish crossover on the MACD lines.
This crossover can confirm an ease in selling pressure and help SAND retest its near-term EMAs.
Derivates data revealed THIS
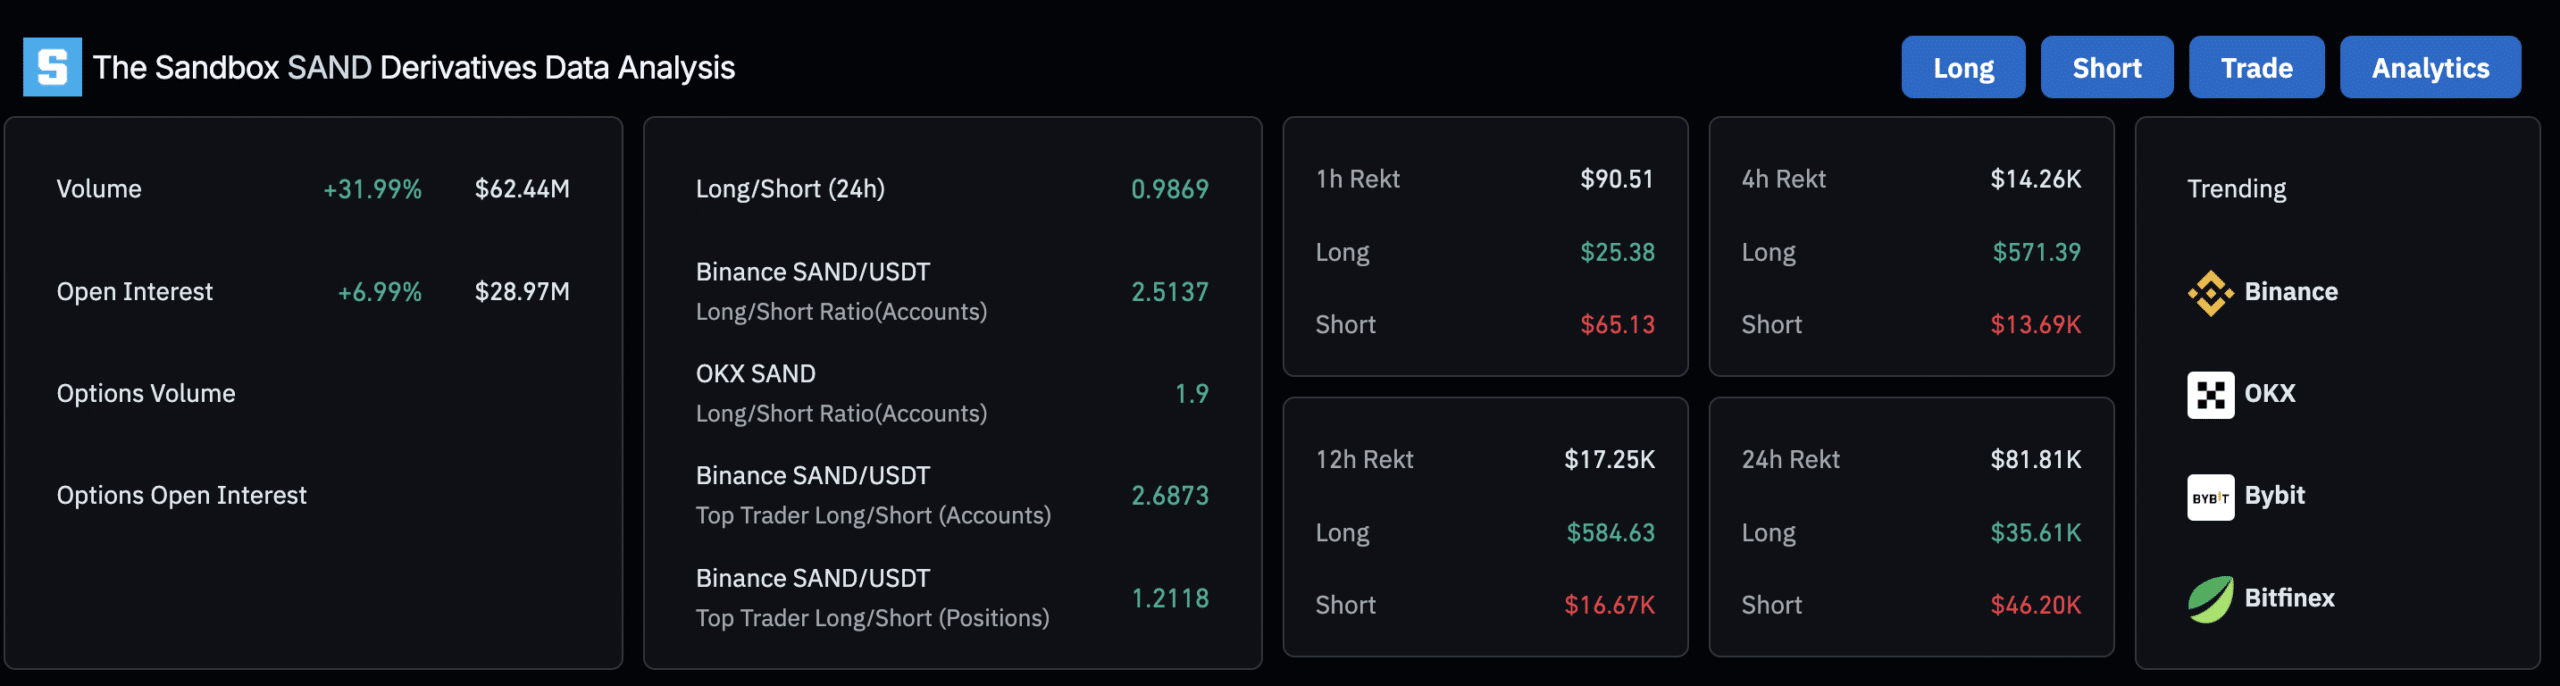
Source: Coinglass
The overall long/short ratio is 0.9869, indicating a slight preference for short positions. However, top traders on Binance [BNB] have a long/short ratio of 2.6873.
Realistic or not, here’s SAND market cap in BTC’s terms
Despite the slight overall short bias in the long/short ratio, other indicators like account ratios, top trader positions, Funding Rates, and liquidations suggest a generally bullish sentiment for SAND.
The increased volume and Open Interest show growing market interest, which could potentially fuel further price movements.
Disclaimer: The information presented does not constitute financial, investment, trading, or other types of advice and is solely the writer’s opinion.