Here’s what traders might be missing about XRP’s price action

XRP’s rise and fall over the past few months, in particular, has been pretty compulsive. When Bitcoin crossed its ATH in mid-April, XRP went on to cling to its 3-year ATH ($1.7 range). Since then, the alt’s correlation with BTC has only intensified. As a matter of fact, XRP’s correlation with Bitcoin oscillated in the 0.20-0.38 range during the initial three months of the year but, the same shared a value of 0.8 at press time.
The aforementioned surge, by and large, wipes away the odds of XRP launching its independent rally. At the time of writing, XRP was trading at $0.590, down by 0.19% over the past week. However, is there something positive that traders can look up to in the coming days? Well, to answer that question, it is essential to do a temperature check of the alt’s on-chain metrics.
Development activity
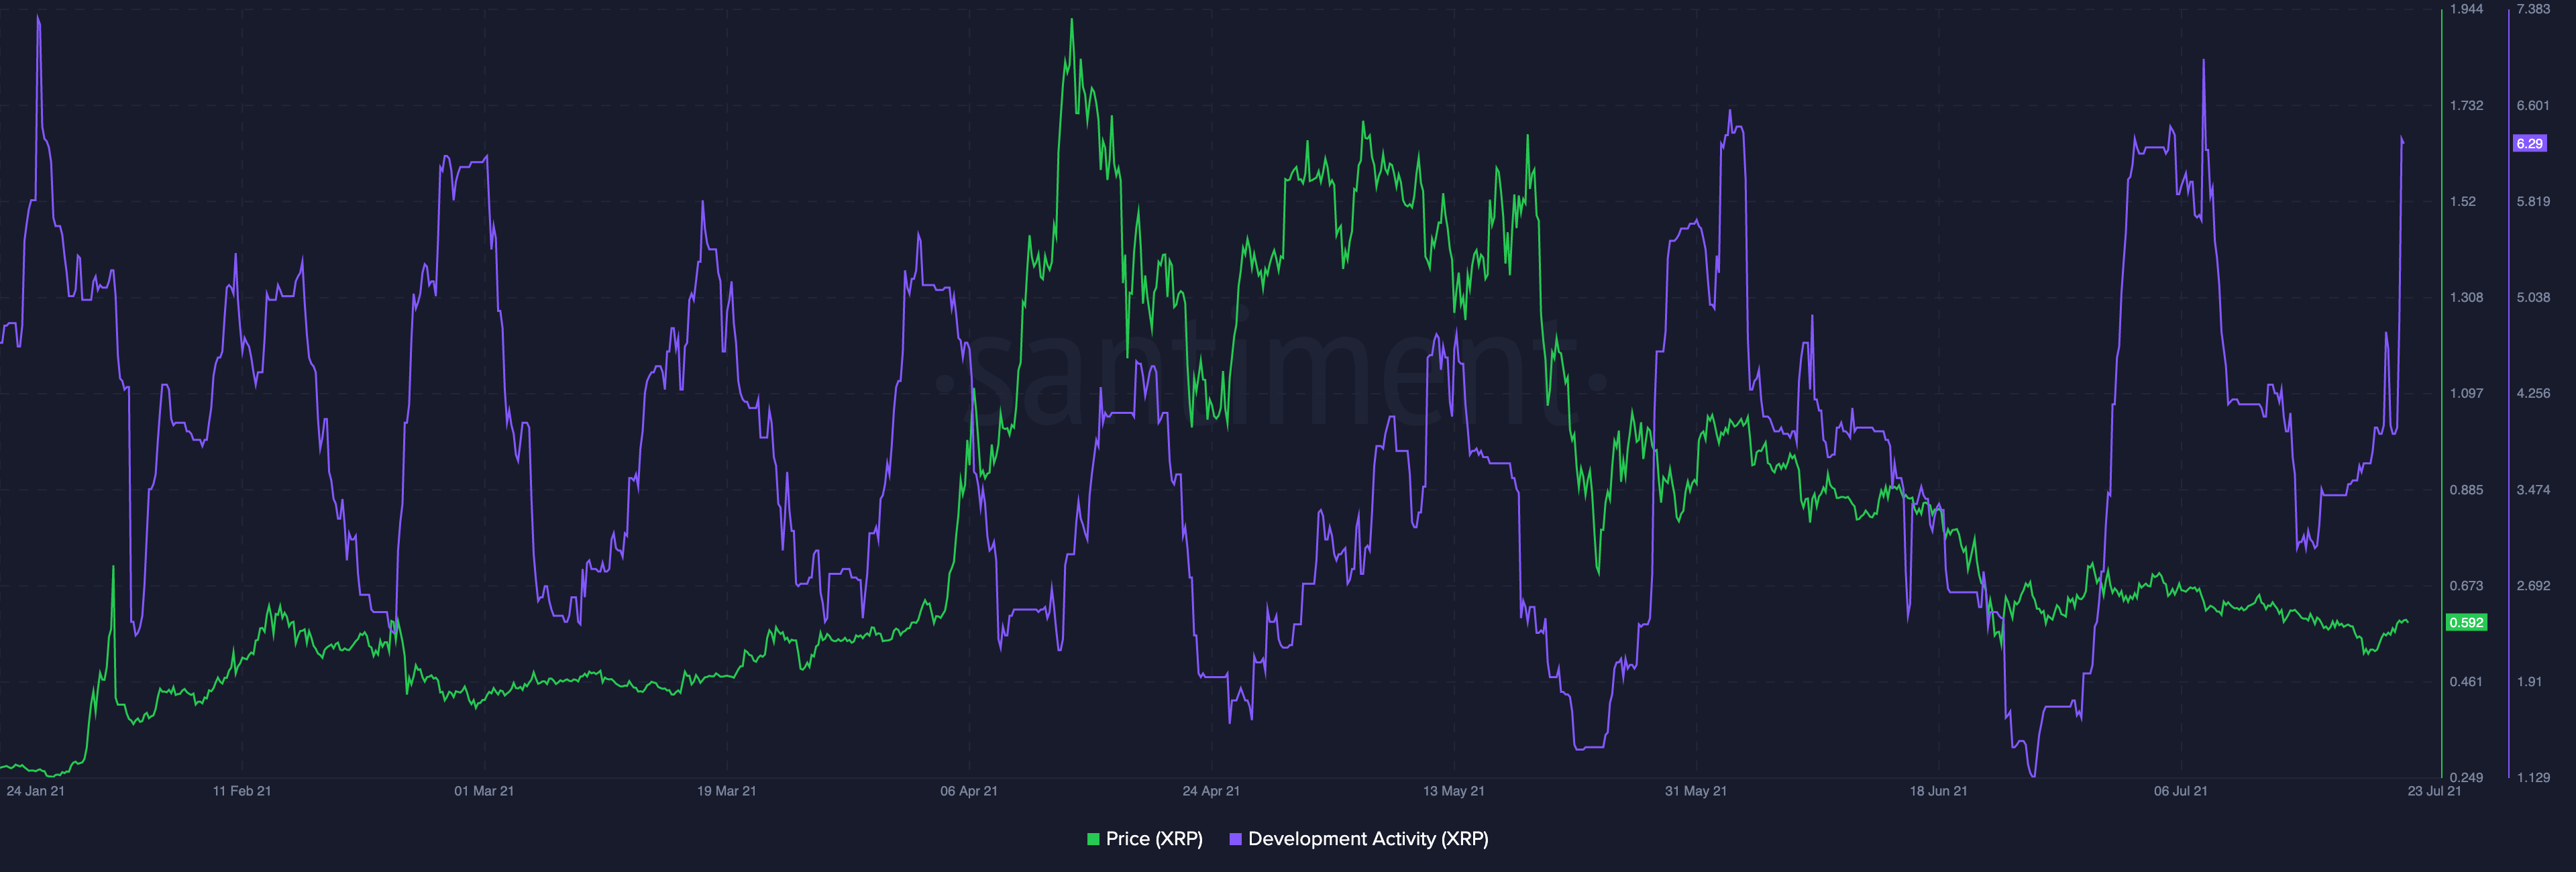
As can be observed from the chart attached, XRP’s network witnessed a massive spike in development activity over the past 24 hours. In fact, the press time level has been touched only thrice since February this year. The hike in this metric, to a fair extent, was anticipated because the developer community has actively been experimenting with different things on the network.
For starters, they are currently working on the XRP Ledger (XRPL) and intend to enable new features and use cases.
At this stage, it should also be noted that Ripple is facing stiff competition from other protocols like Stellar that facilitate cross-border payments. Hence, for Ripple to stand out in the long term, the network’s development activity needs to show improvement from time to time.
Social sentiment
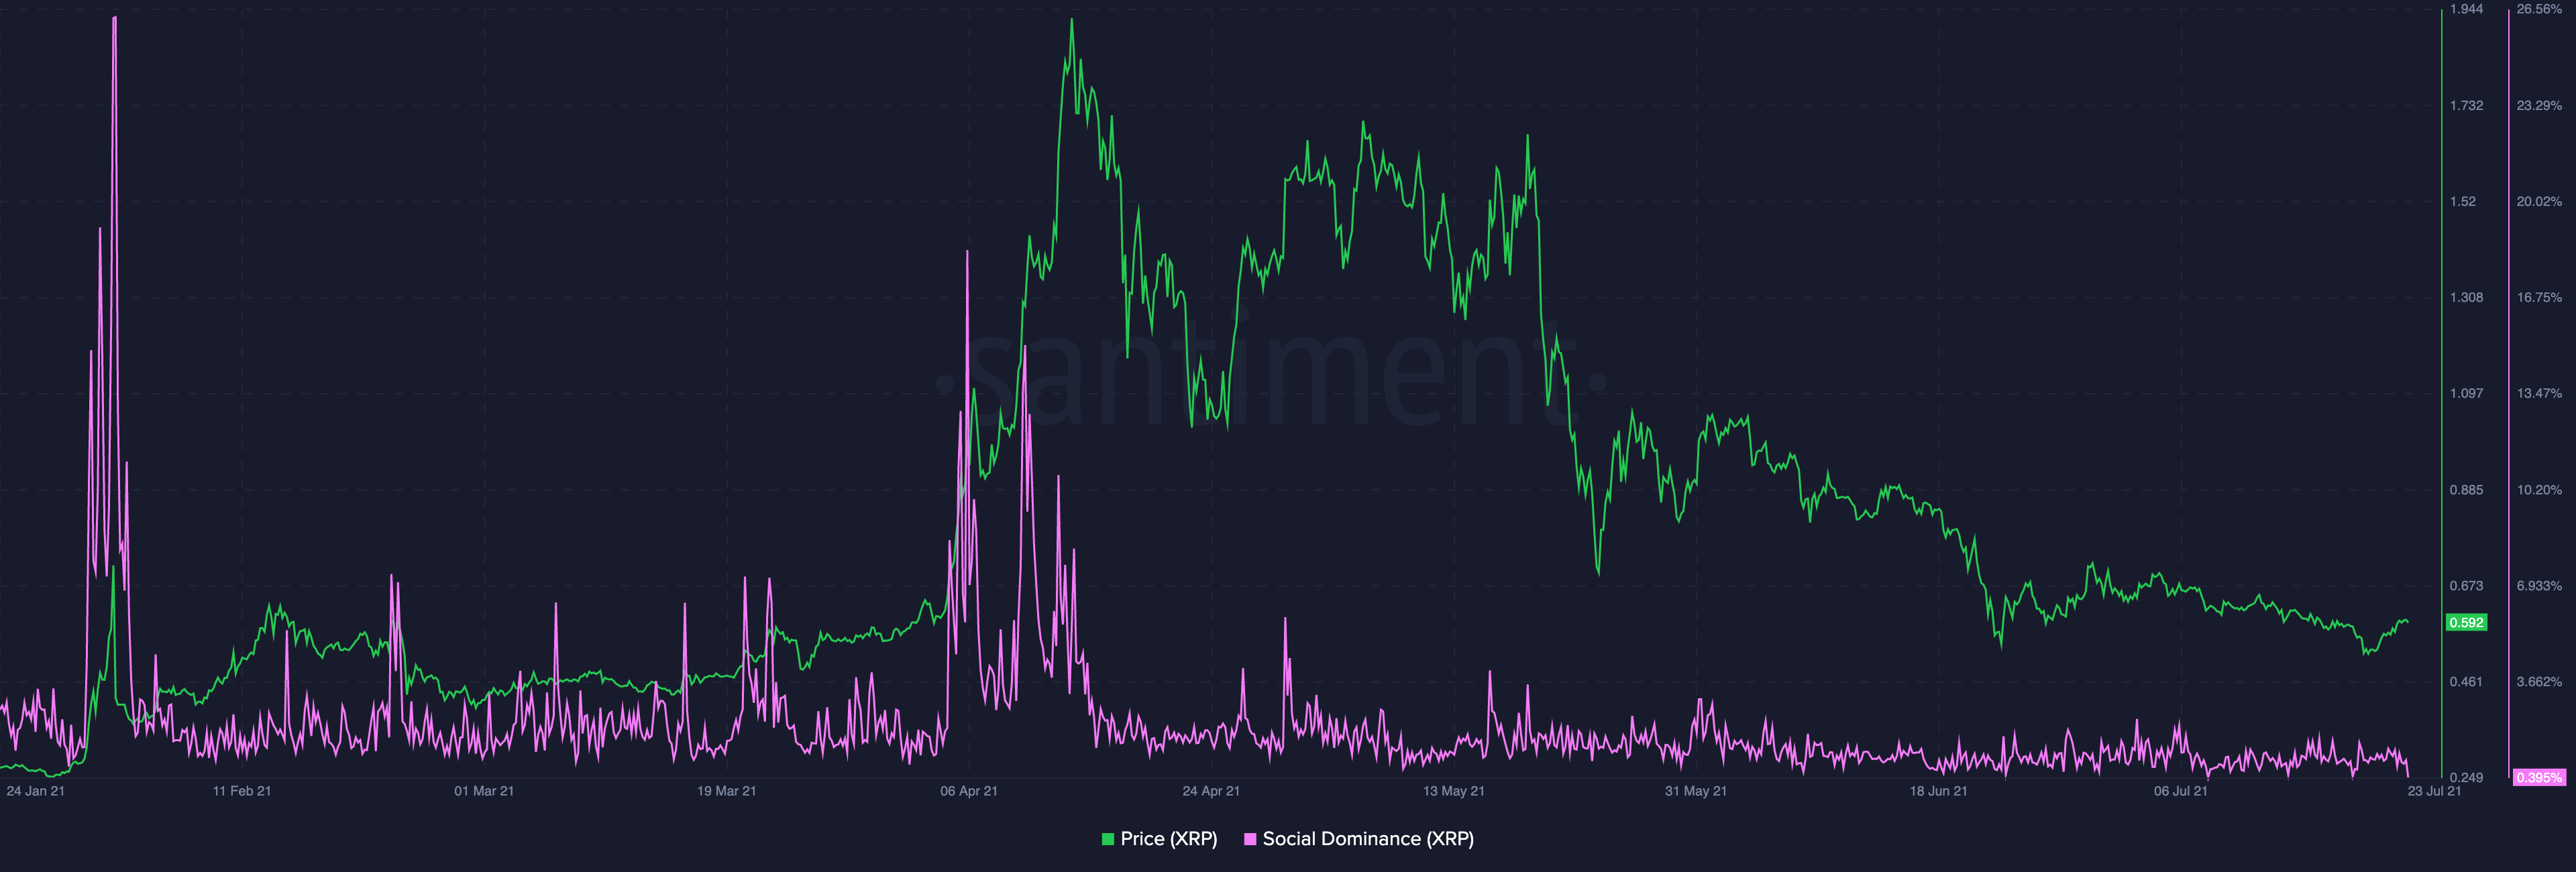
Over the past few weeks, XRP has not seen a surge in both social dominance and social volume. In fact, both the aforementioned metrics seemed to be pretty stagnant at the time of writing. The press time social dominance level (0.394%) of XRP was nowhere close to its late February (26.3%) or early-April (18.36%) highs.
Social sentiment plays a significant role in helping any asset’s price hike. As can be seen from the chart above, whenever XRP has exerted dominance on social media platforms, its price has simultaneously risen. Hence, people from the XRP community need to be more vocal socially in the coming days for this asset to see a trend reversal in the price.
Volume, Volatility, Realized cap
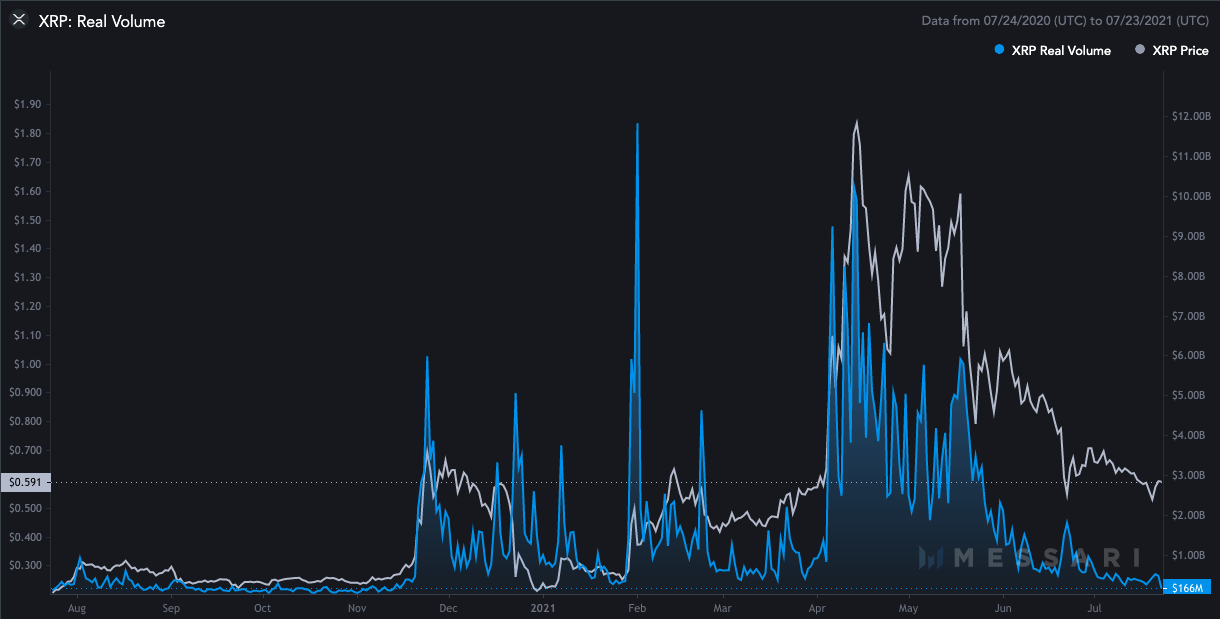
XRP’s real volume, at the time of writing, stood around its November 2020 levels. A figure of $166 million, at press time, is nowhere close to the alt’s $10.26 billion mid-April volume. Now, this essentially implies that neither are traders actively selling nor buying this alt in the market.
XRP’s diminishing volatility too, to a fair extent, has had a negative influence on its price. In fact, at the time of writing, this metric reflected a mere value of 0.81. Notably, the same was in the 2-2.7 range during the alt’s rally in April this year. For the asset’s price to witness any action at this stage, traders need to step in, and both volatility and volume need to pick up.
Additionally, the realized cap indicator which represents the realized value of all the tokens on the network as opposed to their market value has also been declining over the past few weeks. The same was prominently visible on Messari’s chart. This, again, highlights the not-so-healthy state of XRP.
Other than the development activity, most of XRP’s other on-chain metrics seemed to be pretty weak at press time. Hence, an uptick in this alt’s price in the foreseeable future seems to merely be an illusion for now.


