Here’s what would trigger a swing to the upside for Bitcoin

A recent article discussed the possibility of Bitcoin being in a Wyckoff Accumulation as its price targets a comeback towards the $40,000 mark. As traders await BTC’s recovery to its April highs, its short-term trajectory still remains in question. At the time of writing, Bitcoin traded at $34,783, up by 1.7% over the last 24 hours.
Bitcoin 4-hour chart

Source: BTC/USD, TradingView
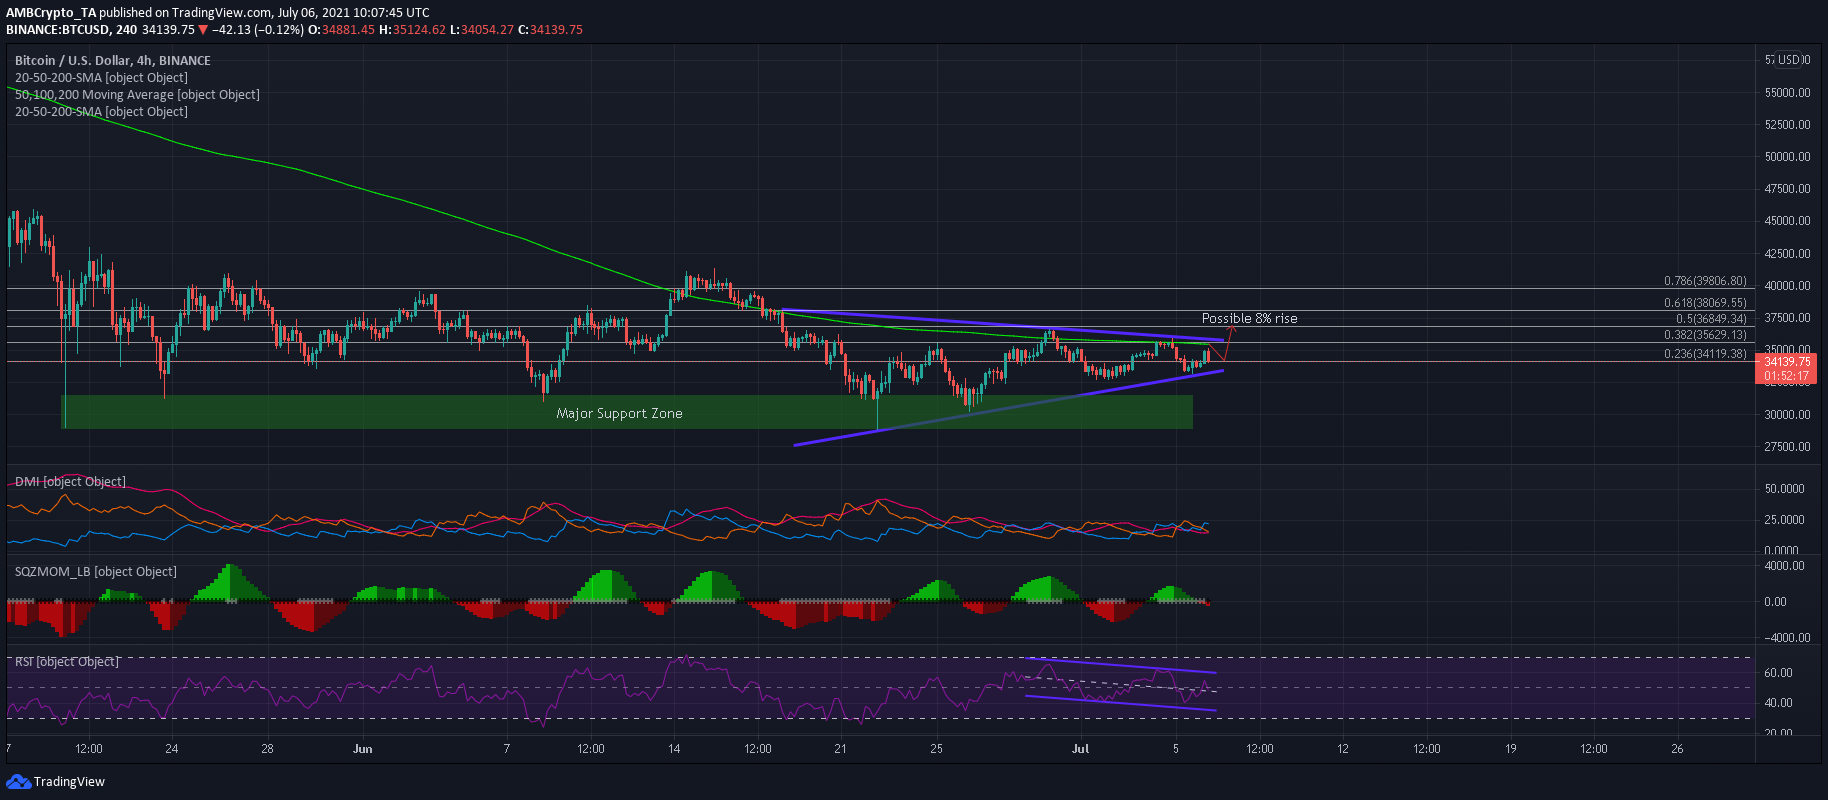
BTC’s reset on June 22 and its steady climb thereafter led to the formation of symmetrical triangle, from where there are near equal chances of a breakout in either direction. The upper trendline of this pattern coincided with the 4-hour 200-SMA (green), 38.2% Fibonacci Extension ($35,629) and the 12-hour 50-SMA (not shown). Hence, an argument can be made that a close above this zone would trigger a swing to the upside and possibly towards the 50% Fibonacci Extension and 29 June’s swing high of $36,617. To invalidate this outcome, sellers can target a fall below 2nd July’s swing low of $32,717- something that can result in a breakdown from the pattern.
Reasoning
Despite gains made since yesterday, bullish momentum was actually receding in the market as per the Squeeze Momentum Indicator. However, a squeeze was currently in effect and volatility could remain low over the coming sessions. The Directional Movement Index was still suggestive of a bullish trend as +DI maintained above the -DI.
However, an ADX reading of 15 reiterated the possibility of some sideways action as the market was less directional. The Relative Strength index did maintain a neutral territory, but a down-channel was a worrying sign. This indicated some weakening in the market over the past week.
Conclusion
A mixed bag of indicators made it arduous to pinpoint BTC’s next resting zone in the coming days. However, its short-term movement could be sideways and between the $34,000-35,000 price level, with slight chances of a rally towards its 50% Fibonacci Extension at $36,850 before the next pullback.


