What to expect from Dogecoin as it approaches $0.15

Dogecoin (DOGE) was on a long-term downslide for over four months. This bearish phase saw a down-channel trajectory (white) on its daily chart.
Assuming there is a strong rejection of higher prices at the convergence point of long-term trendline resistances (dashed lines), DOGE could see a near-term setback before continuing the bullish rally. Any close below the $0.14-zone could lead to a test of the $0.13-support before a buying resurgence. At press time, DOGE traded at $0.1496, up by 3.17% in the last 24 hours.
DOGE Daily Chart
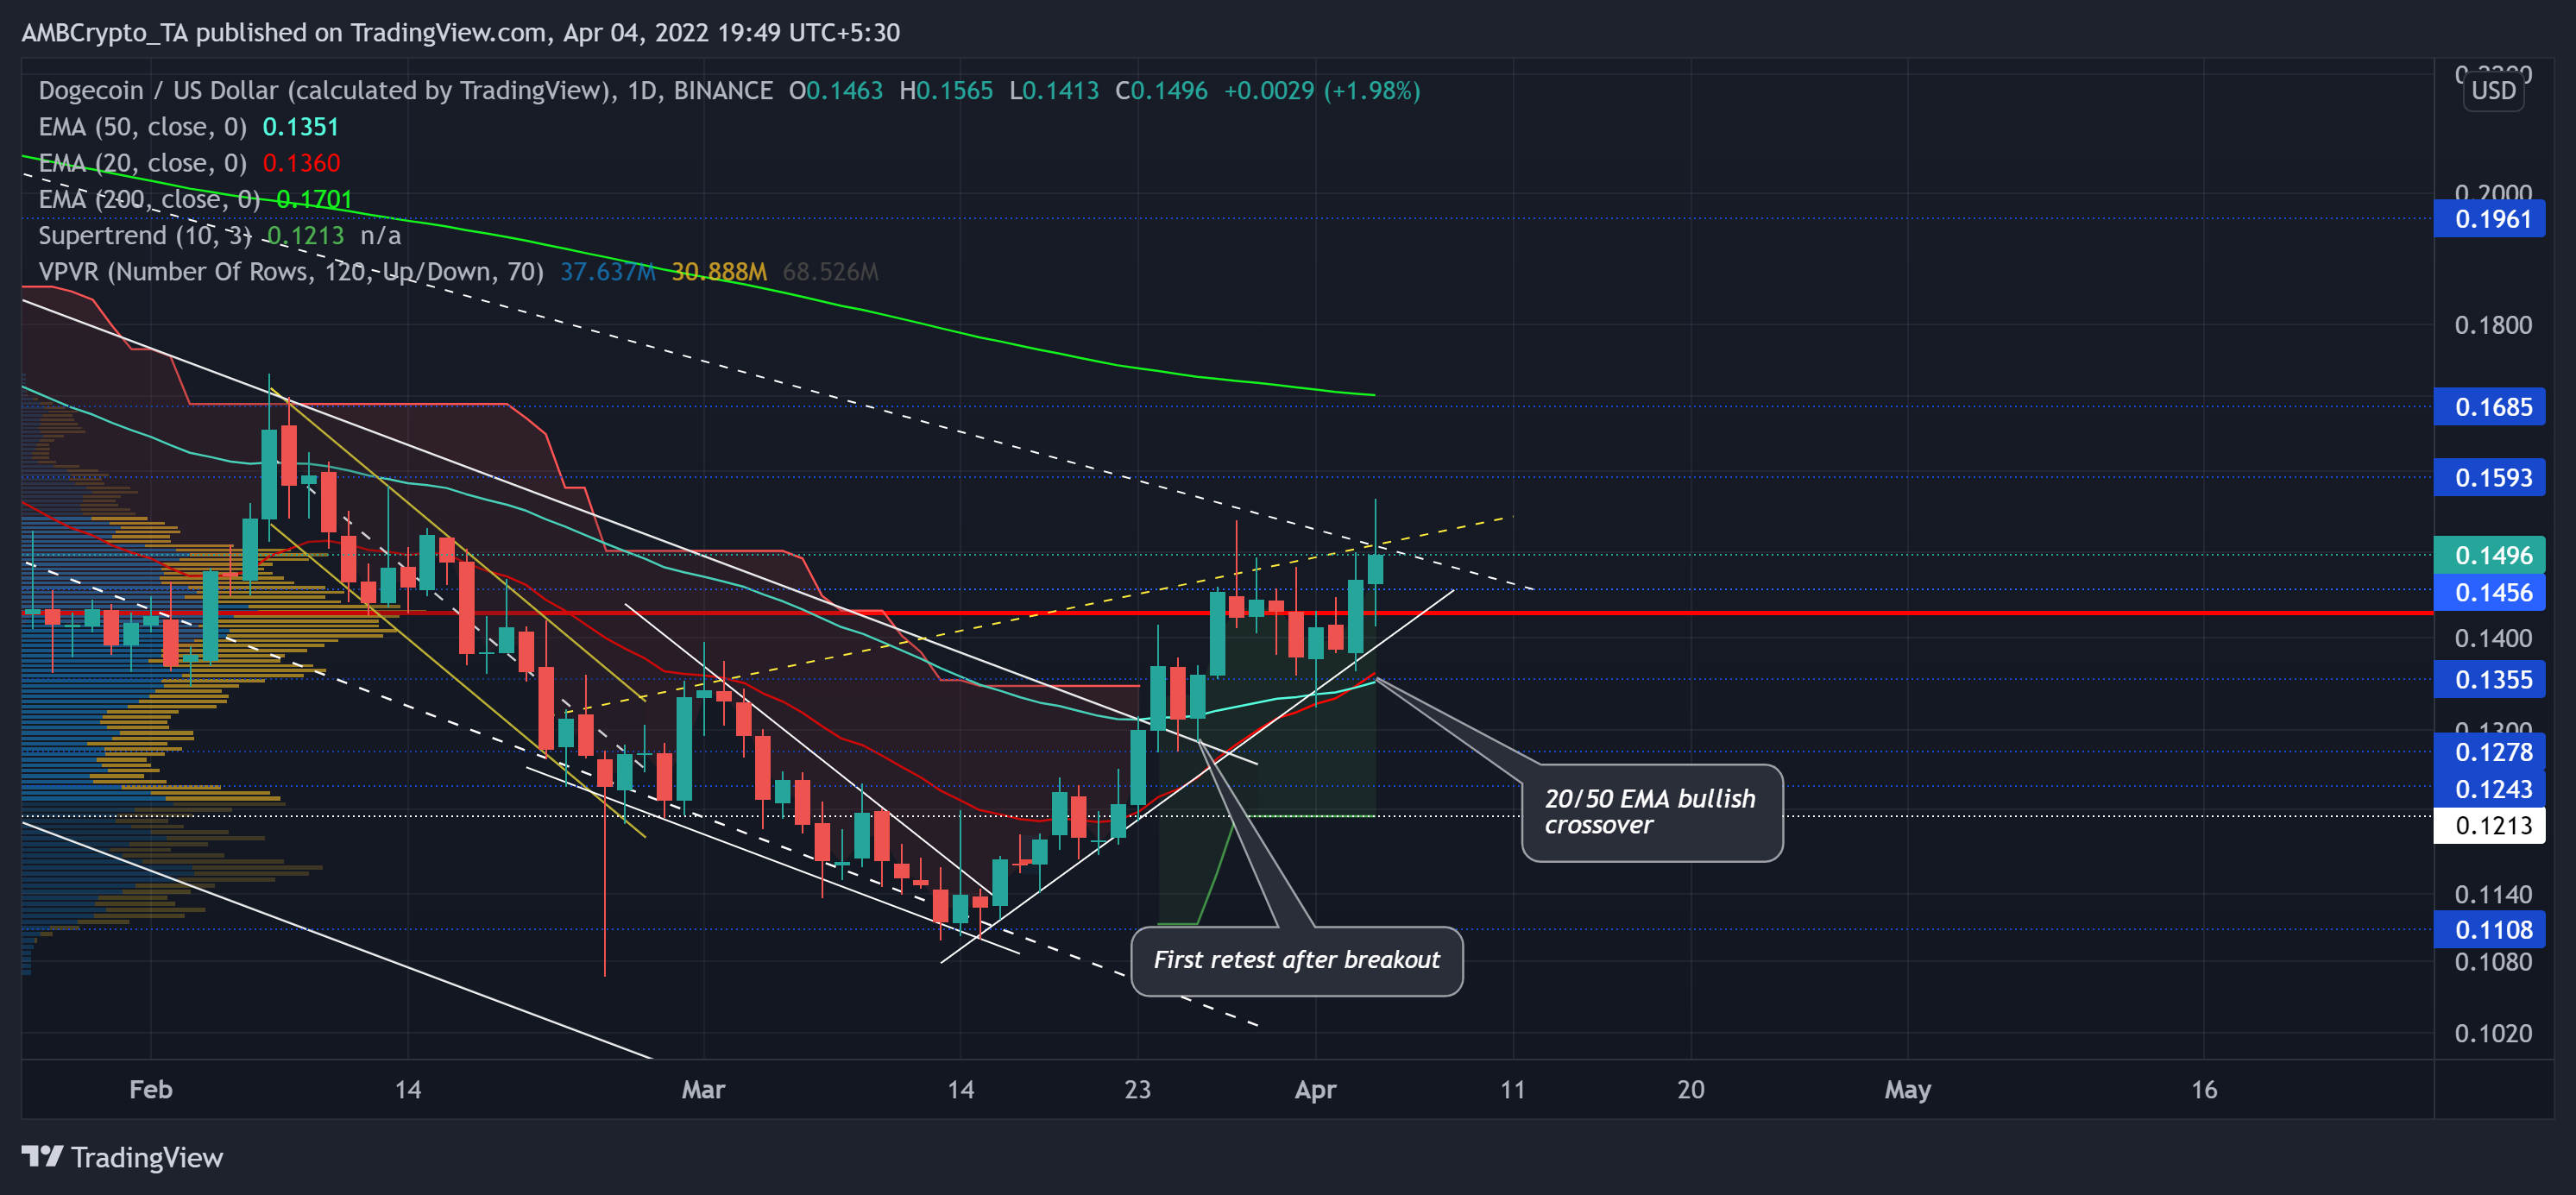
Since its October highs, the alt lost the majority of its value as it plunged towards its ten-month low on 24 February. During this fall, DOGE witnessed a four-month-long descending channel (white).
The downfall led the altcoin to lose the crucial $0.14-mark long-term liquidity range (Point of Control/POC), one that offered the highest liquidity in the last three months. The latest recovery saw a patterned breakout after the alt reversed from its long-term $0.11 support. As a result, the price jumped to its 20/50 EMA and reclaimed the lost POC.
The POC would be an important area to affirm the strength of the current rally. With the confluence of resistances created at the current level, a pullback from here would find a test near the POC in the $0.14-zone. But with the 20 EMA undertaking a bullish crossover, the bulls affirmed their increasing edge in the days to come.
Rationale
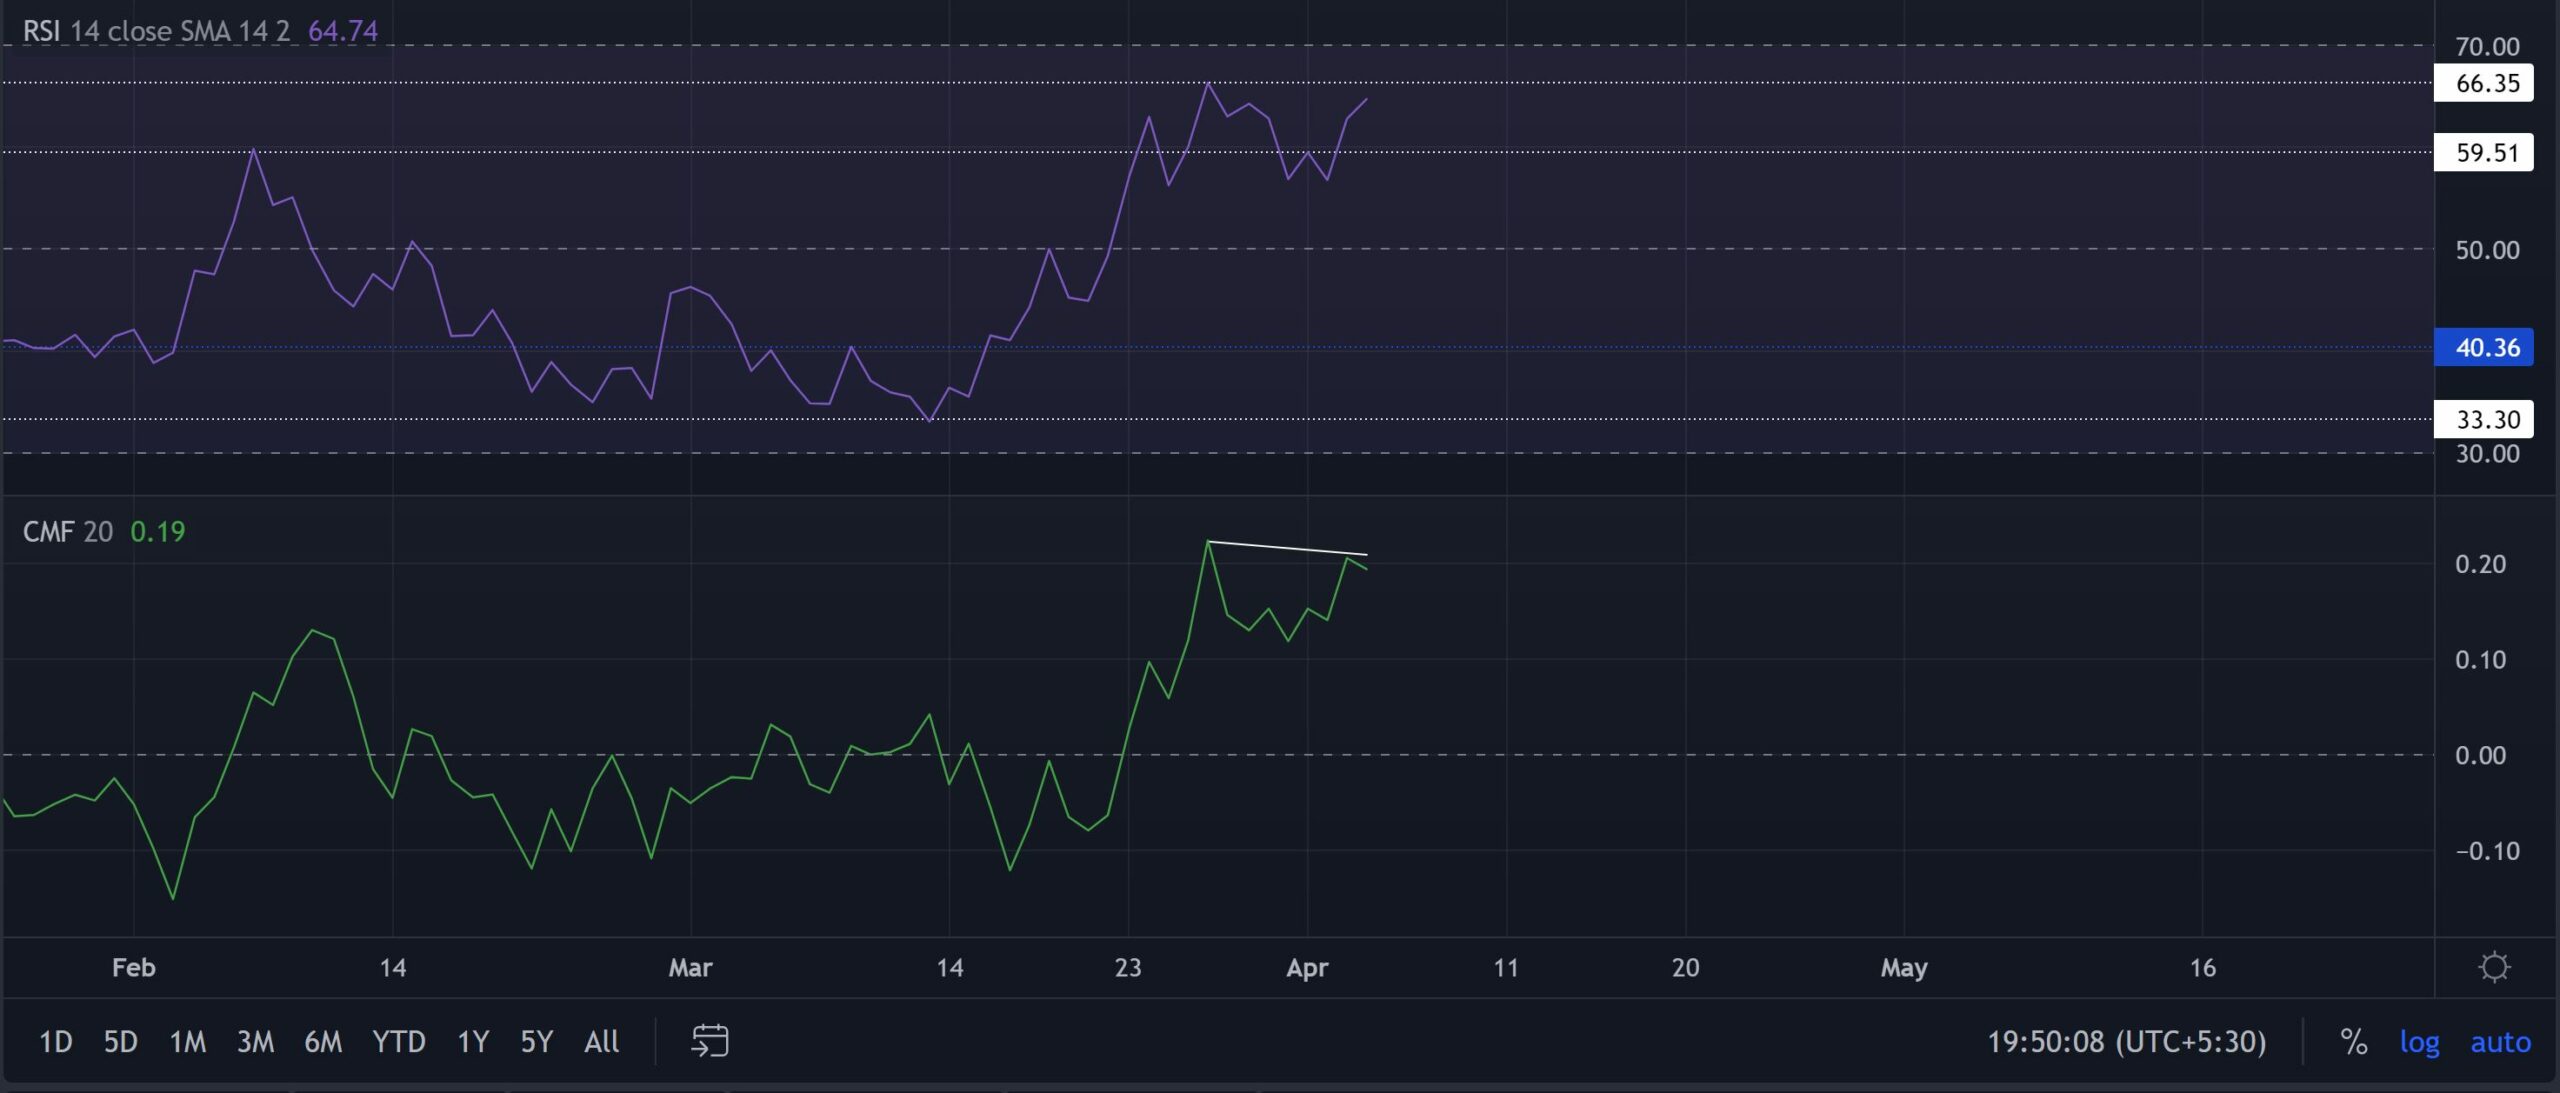
Since the past week, the price saw higher peaks while the RSI struggled to match its weekly high. This reading revealed a weak bearish divergence on its daily chart. Further, the CMF marked lower highs during this timeframe, depicting a bearish divergence with price. Thus, a possible pullback could be lurking around the corner.
Conclusion
Considering the readings on the RSI and CMF a setback towards the $0.13-$0.14-zone is plausible. With the near-term EMA jumping above the 50 EMA, the bulls would likely continue their rally in the days to come.
Also, the dog-themed coin shares a whopping 96% 30-day correlation with the king coin. Thus, keeping an eye on Bitcoin’s movement would complement these technical factors.