Disclaimer: The findings of the following analysis are the sole opinions of the writer and should not be considered investment advice
The Sandbox had a market cap of $4.7 billion at the time of writing, ranked 33rd on CoinMarketCap. It saw a dip as low as $2.6 in the past two weeks but has recovered well since then. The short-term bias for SAND was strongly bullish, but the price has come to test a long-term trendline resistance, which also had some confluence with a horizontal level of significance. Will SAND be forced back to an area of demand, or can bulls drive the price toward $5 and beyond? Bitcoin would likely have an impact as well.
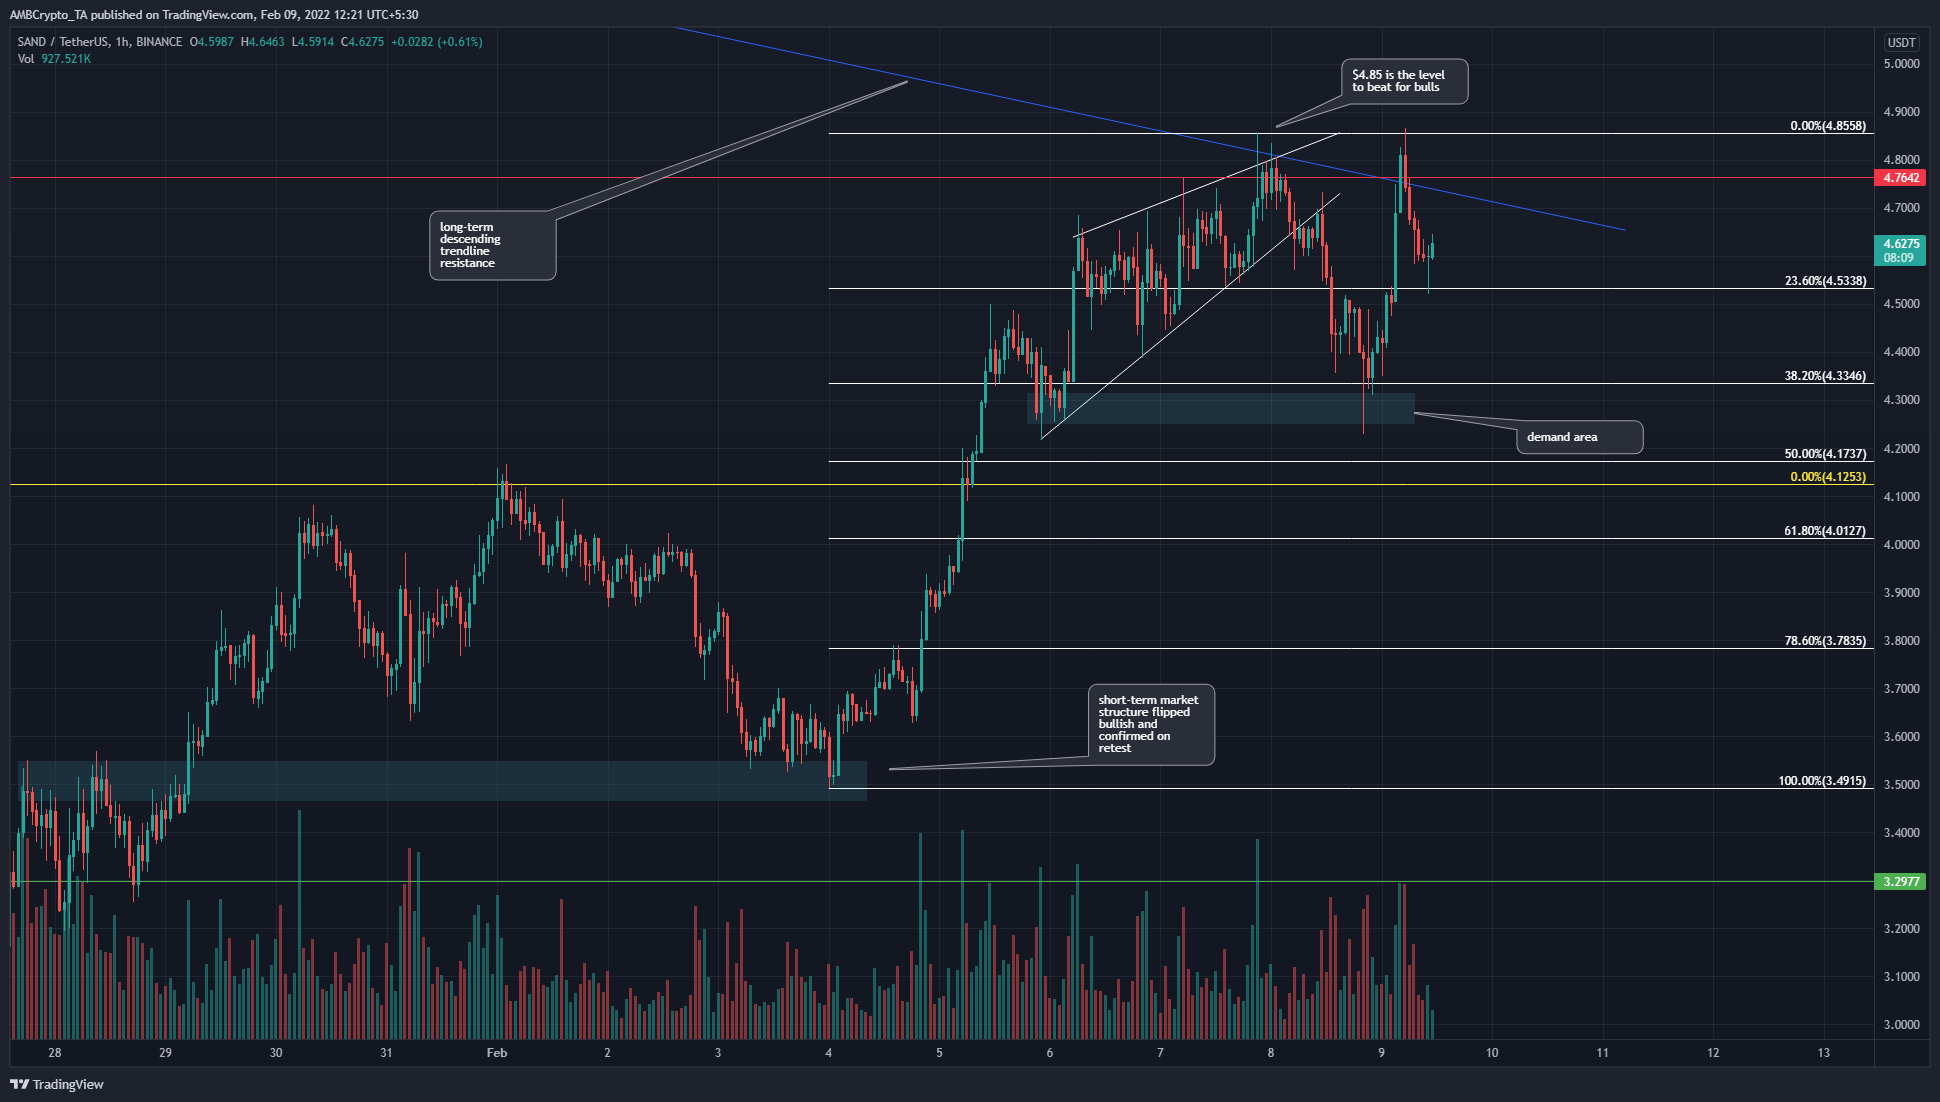
Source: SAND/USDT on TradingView
In late January, SAND was already showing signs of a bounce when it broke above the $3.21 level. Subsequently, it faced resistance at $3.5 but since then it has managed to climb to $4.12 and retested $3.5 as an area of demand as well. This indicated that the market structure in February was confirmed bullish after SAND moved back above $4.12.
A set of Fibonacci retracement levels were drawn based on SAND’s move from$3.49 to $4.85 (white). In the short term, the $4.3 area has seen demand, and in the past few hours, it has once again seen strong demand step in. This area was retested after the price formed an ascending wedge (white) and broke beneath the pattern.
At press time, the price had once again been rejected near $4.85, with the trendline resistance (blue) yet to be broken as well.
Based on the price action, a bullish bias seemed warranted. $4.12 was a support level to keep an eye on, while the $4.85 highs will be a place bulls will look to drive the price beyond.
Rationale
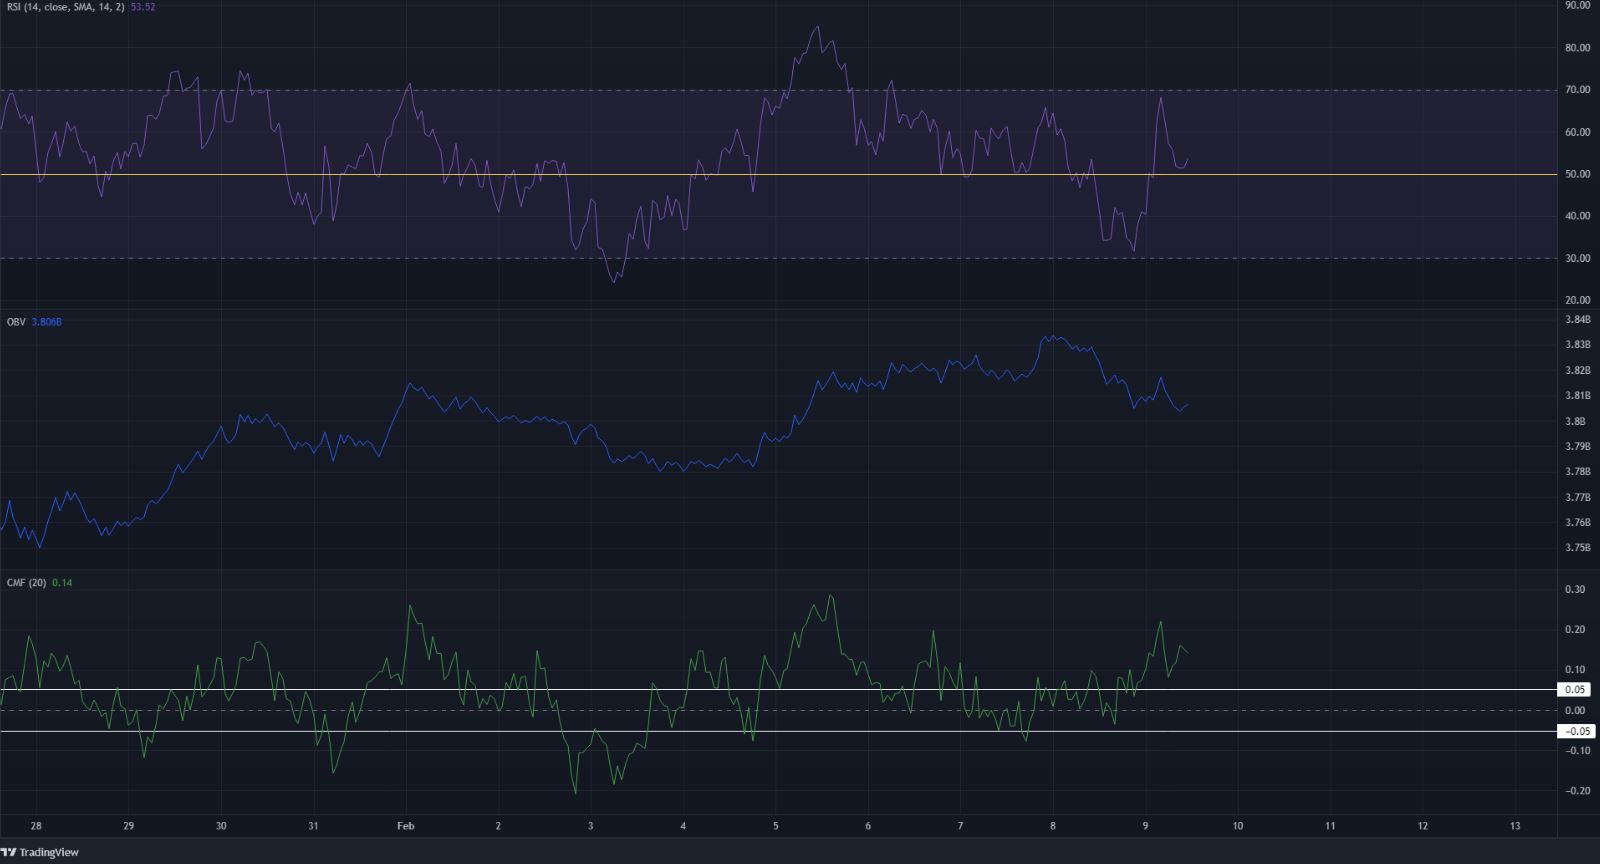
Source: SAND/USDT on TradingView
On the hourly chart, the RSI oscillated a bit wildly in the past couple of days. Overall, the RSI showed a bullish trend in the week prior to the pullback from $4.85. The OBV, too, has formed a series of higher lows in the past two weeks, which showed that demand has been rising behind the rise in prices as well.
The CMF has been between -0.05 and +0.05 for a major part of February, and in recent hours it has risen back above +0.05 once more. This showed that capital flow was once more headed into the market.
Conclusion
The indicators showed steady demand behind SAND, while the market structure was also bullish. A revisit of $4.3 and $4.12 was not improbable, while a session close below these levels and their flip back to resistance would indicate bears were in the driving seat again. To the upside, $5.15-$5.2 are levels to take profit at.