Here’s why BONK traders can expect another 21%-46% price bounce
A Bitcoin sell-off could quickly extinguish the flicker of hope in recent days and send BONK's price sliding once again.

Bonk [BONK] has emerged as one of the memecoins beginning to make a strong case for itself over the weekend. As Bitcoin [BTC] inched closer to the $64K local supply zone, some altcoins recorded their own short-term gains, outpacing those of BTC in the process.
BONK is one such altcoin. It has rallied by just over 10% in the last 24 hours. Though a weekend, it also recorded a daily trading volume spike of 152%, giving the rally some substance.
Coinalyze data showed that BONK Open Interest was up by 33.9% too. Strong speculative demand and spot volume hinted at a potential BONK bullish continuation in the coming days.
This is why AMBCrypto took a closer look at the price action to understand what trends swing traders can expect next.
BONK’s long-term trend has not yet changed decisively
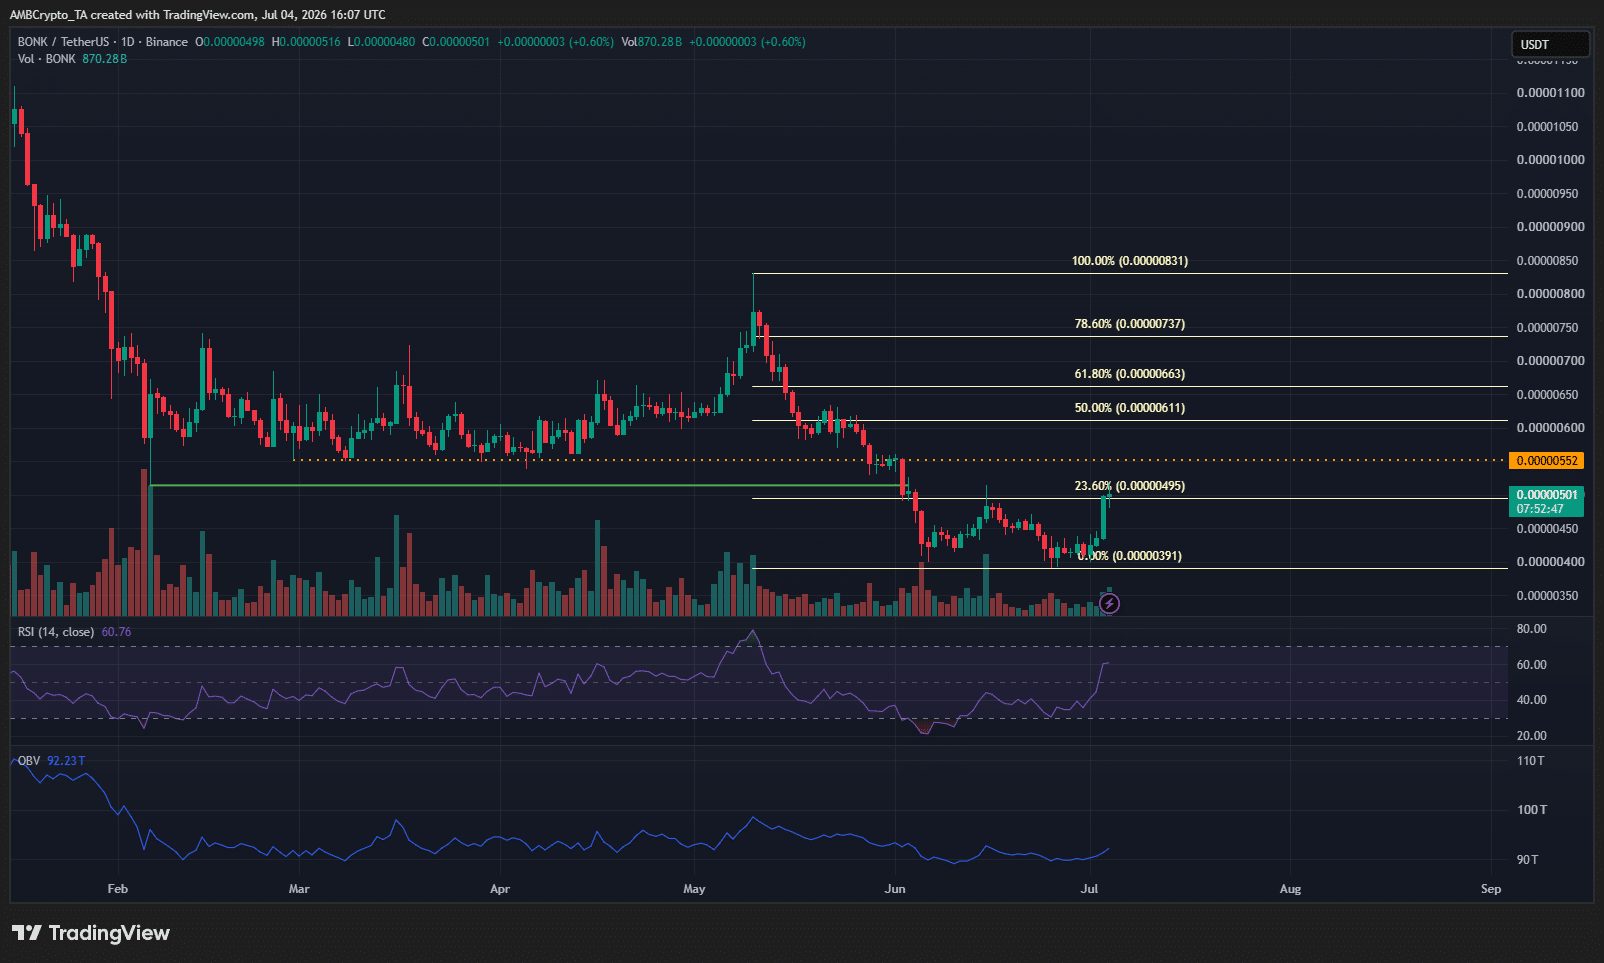
The swing structure of the memecoin was bearish on the 1-day timeframe. This structural break came early in June (green), and a new swing low at $0.00000391 was registered.
Since posting this low, BONK has bounced by 27.88% in 9 days. At the time of writing, it was challenging a local supply zone at $0.000005.
The RSI on the daily timeframe recovered above neutral 50, and the OBV seemed to be approaching the mid-June local high, just like the price. And yet, investors and swing traders must remember that the higher timeframe trend remained bearish.
A price bounce all the way up to the 78.6% Fibonacci retracement level at $0.00000737 might be possible. The $0.0000061-$0.0000073 area is a place that could initiate the next impulse move to keep the swing bearish structure going.
Traders’ call to action – Cautiously bullish
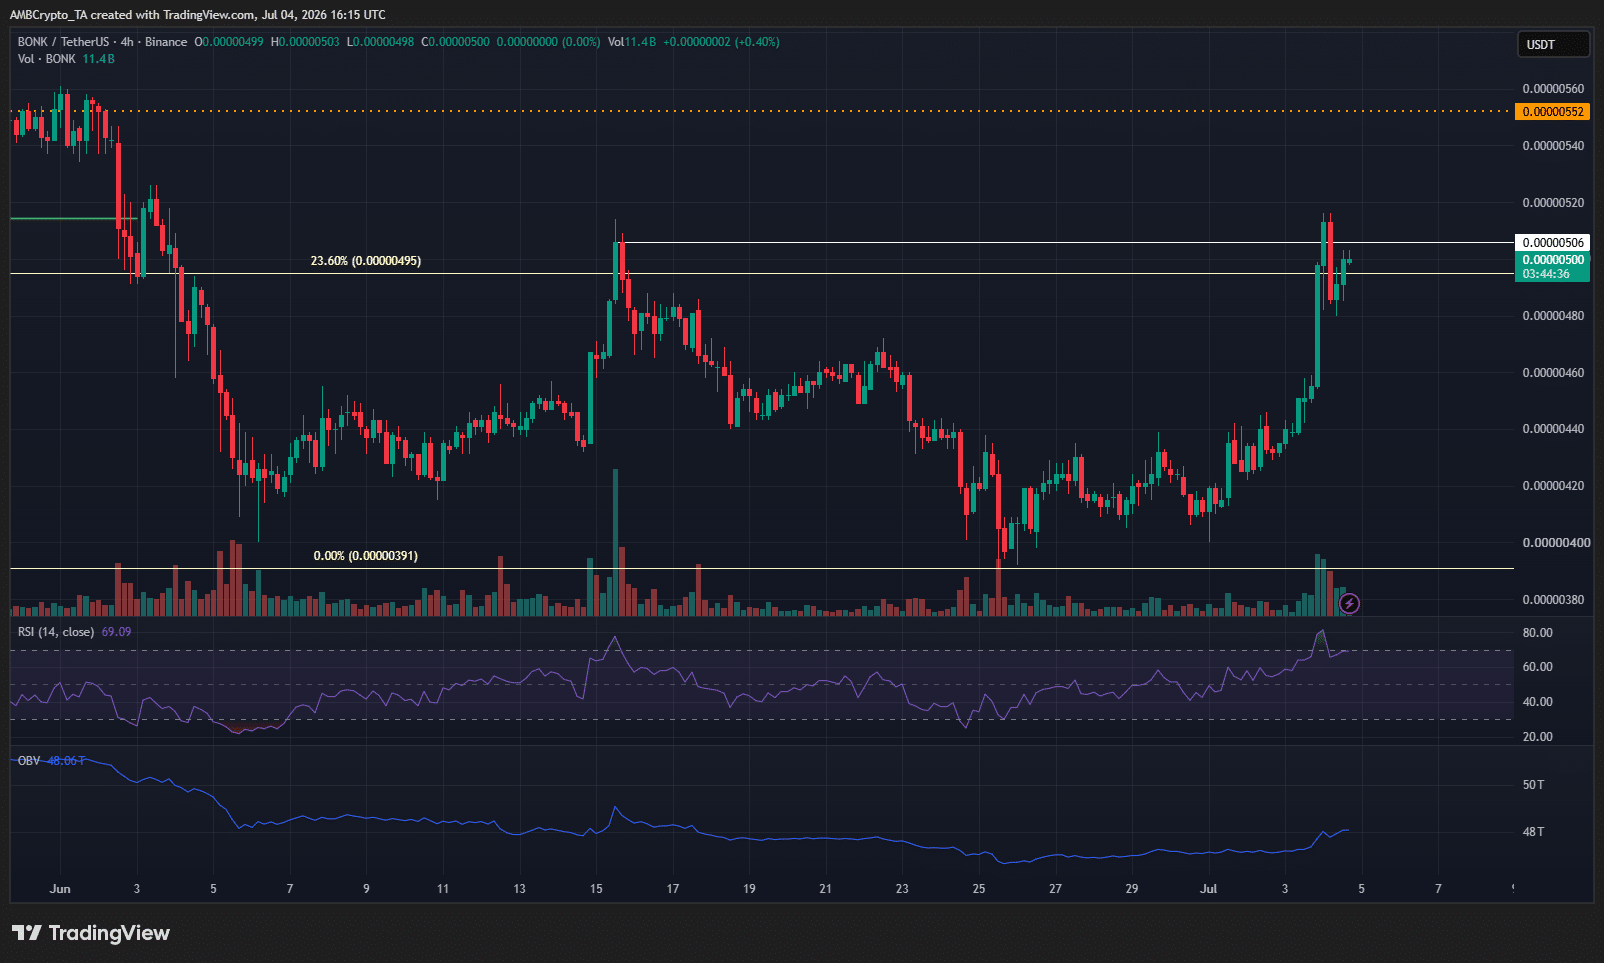
The local resistance level at $0.000005 was momentarily breached, but BONK faced a slight setback in recent hours of trading. If this level is flipped to support, it could offer a short-term buying opportunity.
The upward price targets would be $0.0000061-$0.0000073, in line with the higher timeframe structure.
Traders should also keep an eye on Bitcoin trends. A sell-off for the leading crypto could quickly extinguish the flicker of hope in recent days and send BONK prices sliding once again.
Final Summary
- BONK has made a sizeable price move in the last 24 hours, backed up by strong trading volume.
- Higher timeframe structure was bearish, but there is a chance the current bounce could extend by another 21%-46%.