Here’s why Cardano can see an accumulation phase in the next few weeks

The long-term trend for Cardano has been downward. It broke beneath the $1.91 mark in November and has steadily fallen to the $1.2 level since then. In recent weeks, the price fell as low as $0.91, although it rebounded back above $1. There was some indication of an incoming bounce for Cardano from the $1 area. Would this scenario occur, and can Cardano reverse the downtrend?
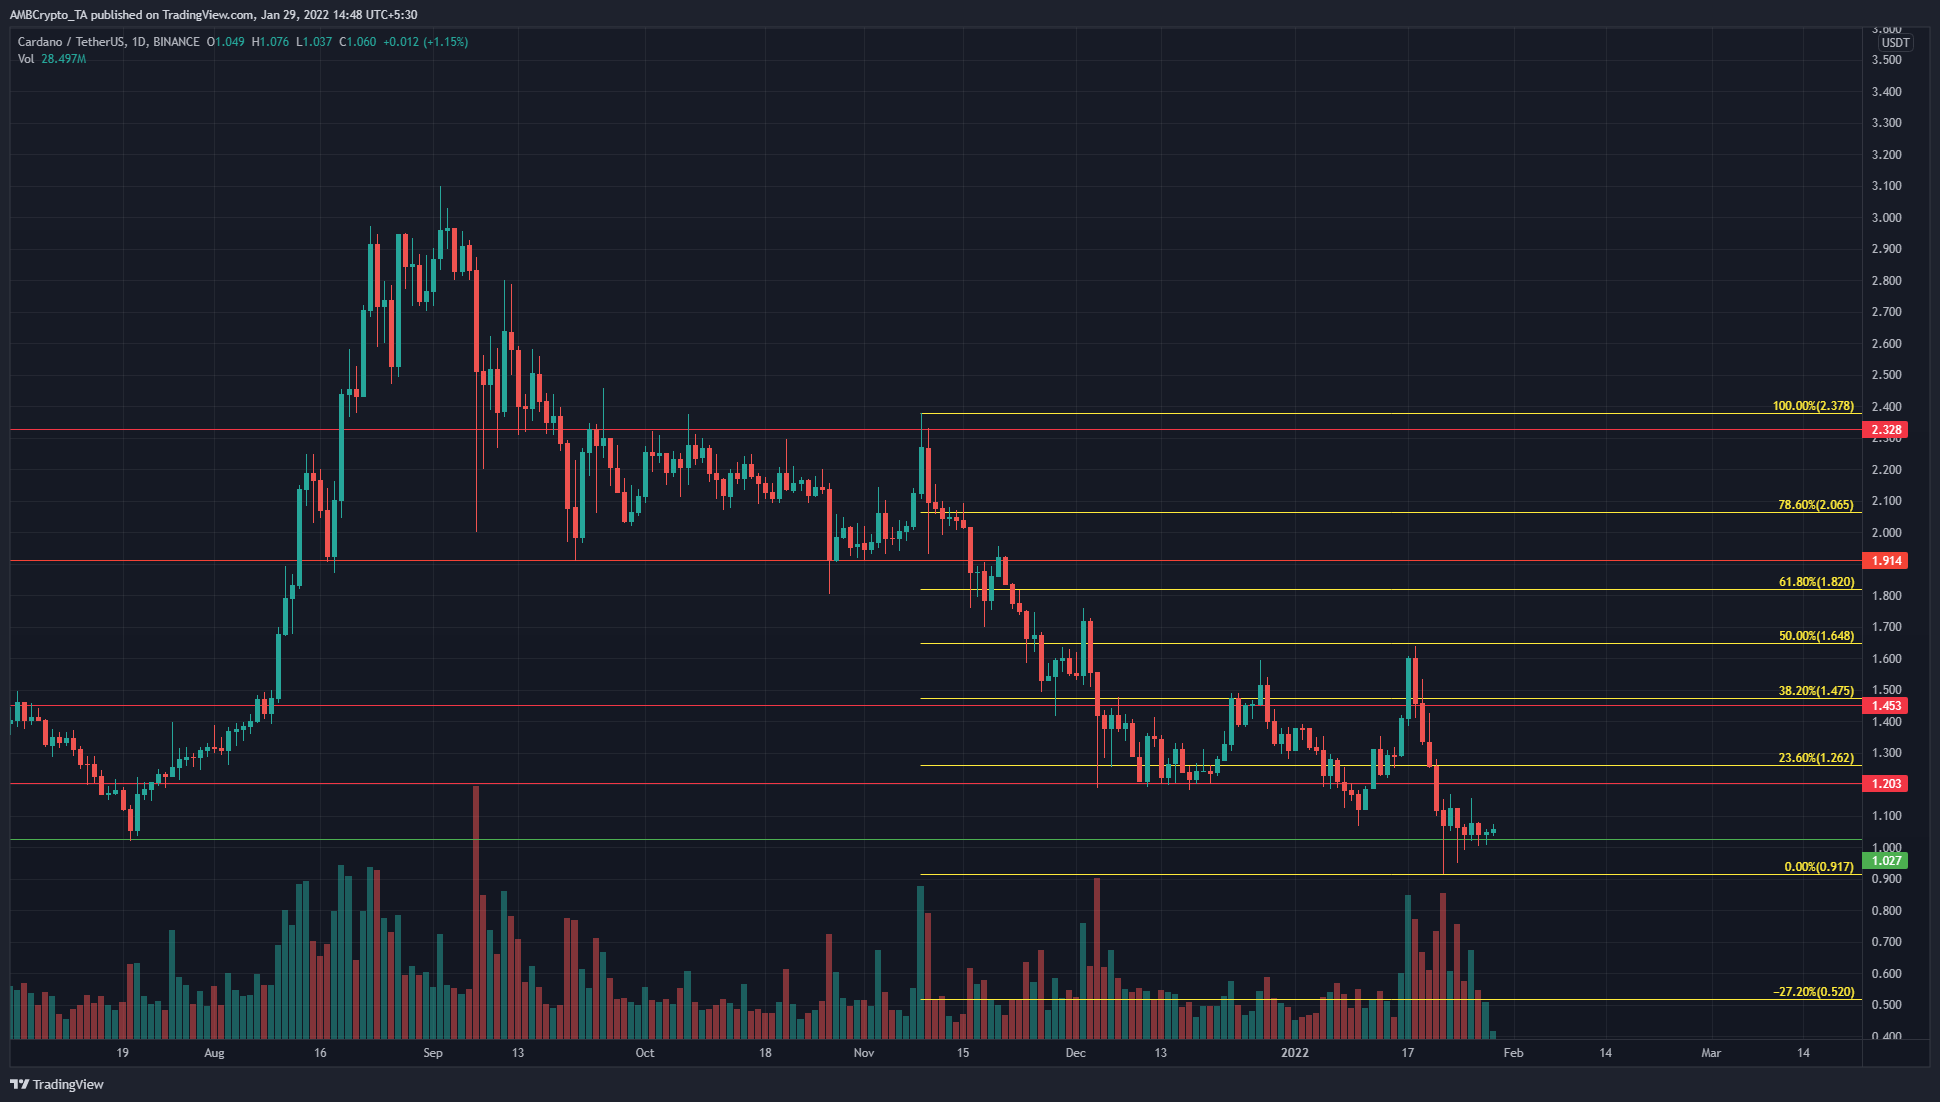
Each time a crucial support level was broken in the past few months, it has been retested and confirmed as resistance. This happened at the $2.32 level throughout October, the $1.91 level in mid-November, and could now repeat for the $1.2 level over the next few weeks.
A set of Fibonacci retracement lines were drawn based on ADA’s drop from $2.32 to $0.91 from November to mid-January. These levels appear to be respected quite well in the same time period and have acted as significant levels of support and resistance.
The 23.6% retracement level at $1.26 has confluence with the important support level at $1.2, which made it an area where buyers and sellers would skirmish for control. It was likely that sellers would once more win, in continuation with the former trend.
A set of equal lows need to be formed on the charts, followed by a breakout, to signal that an accumulation phase had occurred and the price was once more driven by buyers. That has not yet happened for ADA.
Rationale
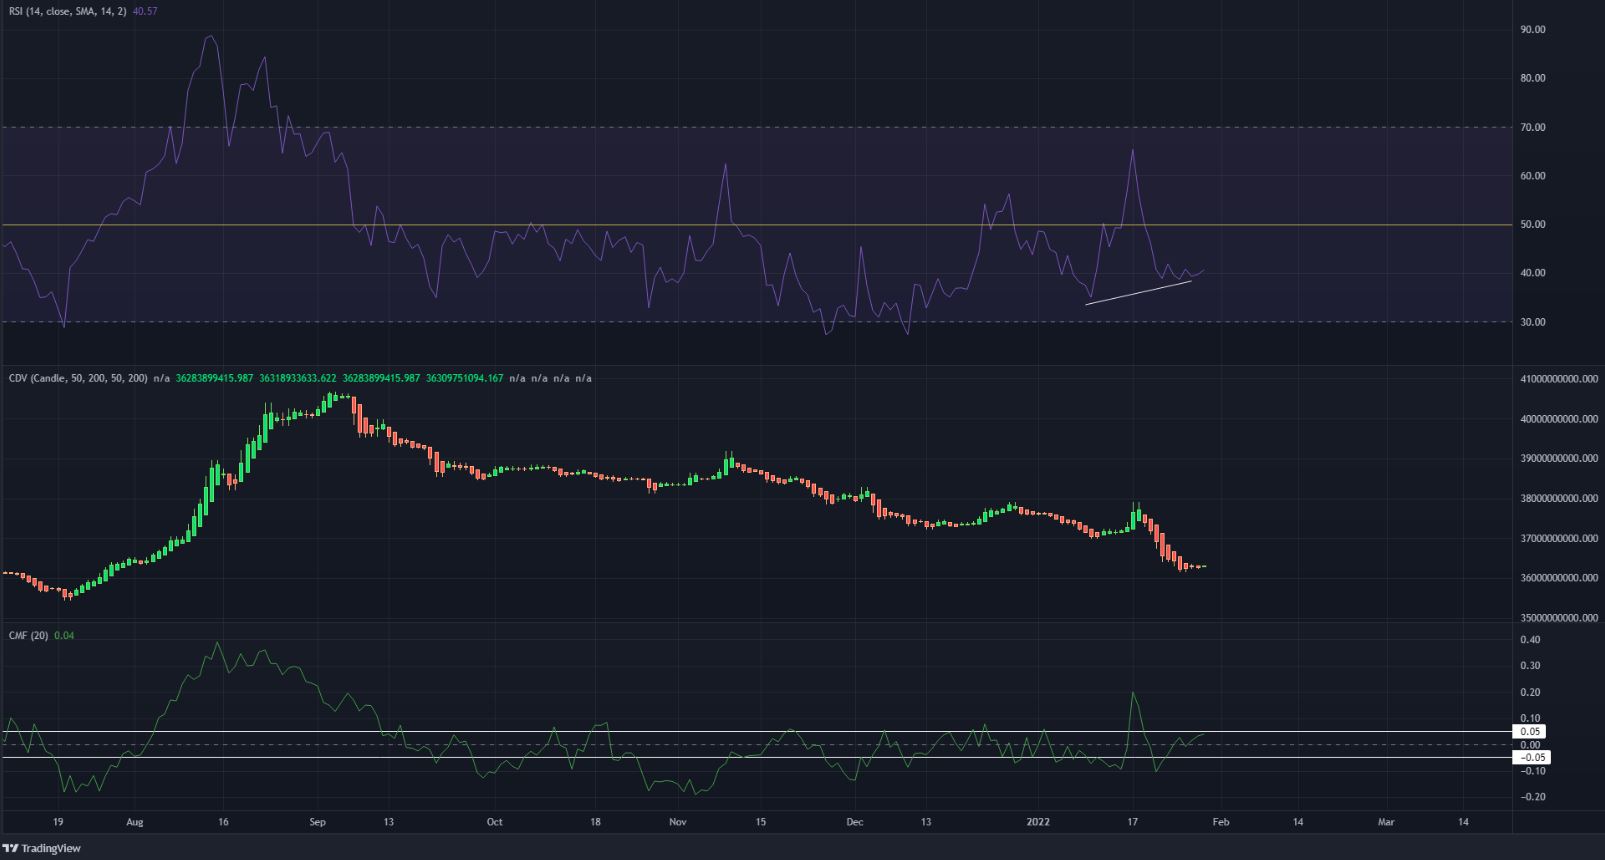
The RSI formed a higher low on the daily chart even as the price formed a lower low. This was a bullish divergence, coupled with an area of strong demand at $1. Hence, a move upward could occur, and climb as high as $1.26 before rejection. This would affirm that the former support was flipped to resistance. Such a move would also entice late buyers with a show of bullish strength before reversing.
The Cumulative Delta Volume was in a decline, alongside the price. It also showed that demand was yet to be seen at the $1 mark, as sellers have remained strong in the past couple of weeks. The Chaikin Money Flow climbed toward +0.05 as well, and could move above to denote strong capital flow into the market.
Conclusion
In the coming days, ADA could see some demand which could propel the price to $1.2-$1.26. However, at the time of writing a move further north was unlikely, as sellers are still strong in the market. Below $1, the next level of support lay at $0.81.