How ADA short sellers can deploy this strategy to remain profitable

Disclaimer: The findings of the following analysis are the sole opinions of the writer and should not be considered investment advice.
After struggling to break the chains of the midline of its up-channel (yellow, dashed), Cardano’s [ADA] saw an expected breakdown over the last few days.
This decline fixated its position below the EMA ribbons to reflect a broader bearish momentum. The bulls could now aim to continue the ongoing squeeze before a plausible breakdown. At press time, ADA was trading at $0.4652.
ADA Daily Chart
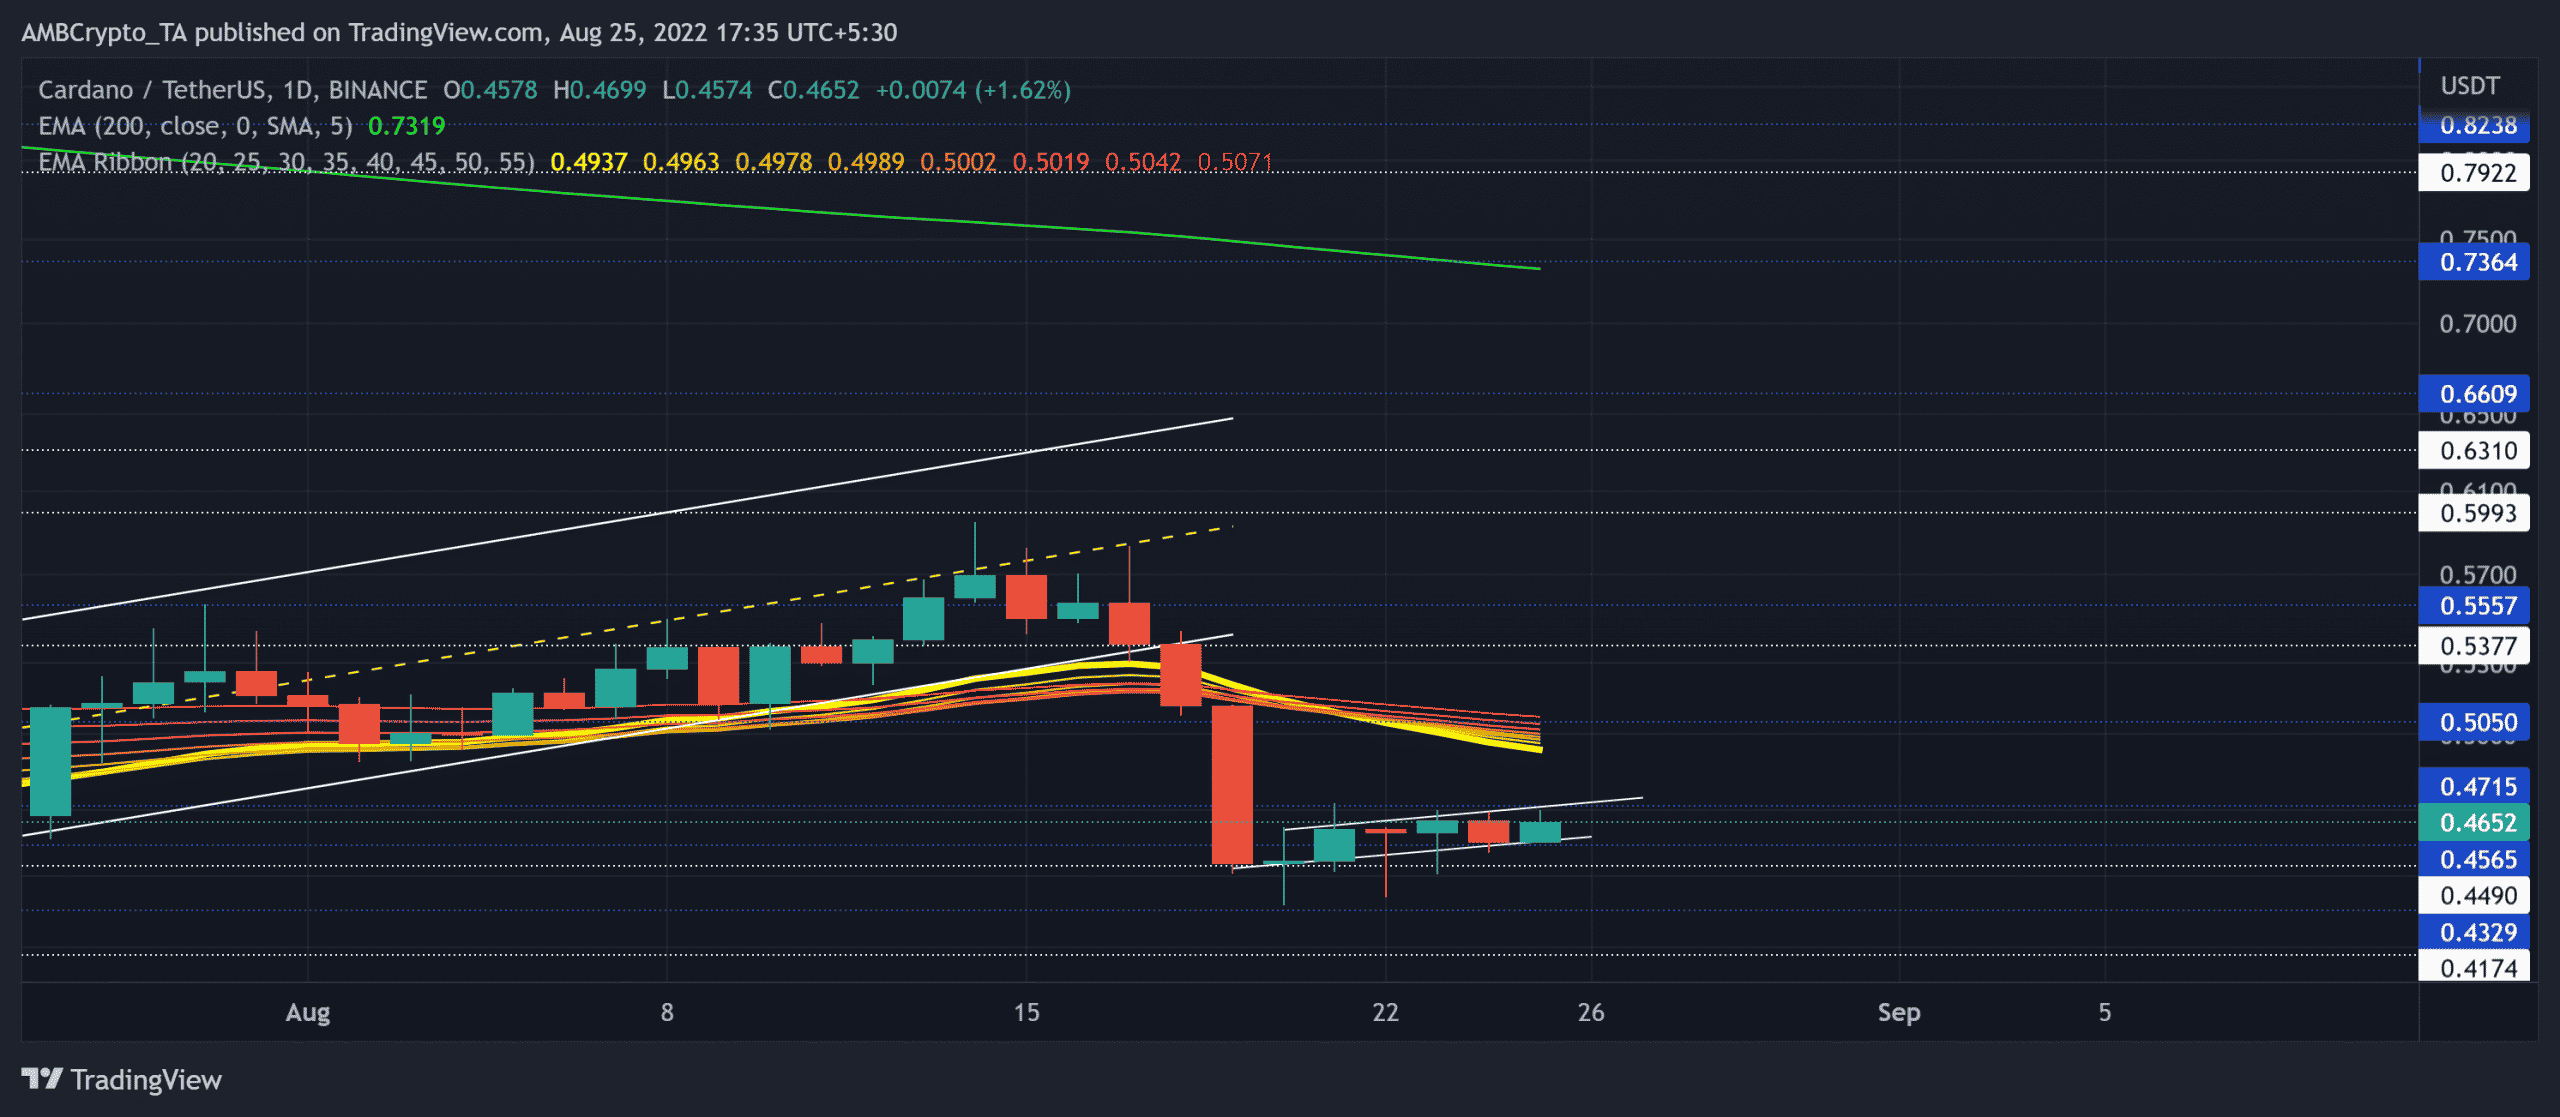
After hovering in the lower half of the up-channel for two weeks, ADA snapped its boundary beneath and steered into a bearish track.
This breakdown broke the coin’s squeeze phase to reveal a bearish edge. The movements in the last few days hinted at a bearish flag-like structure in the daily timeframe.
To top it up, the decreasing volume trend during the pattern formation makes the altcoin more susceptible to a potential breakdown.
A compelling close below the $0.45-level could aid the alt in retesting the $0.41-$0.43 range in the coming sessions. So the next few candlesticks could confirm the chances of a continued downtrend.
The bearish crossover on the 20/50 EMA has further reiterated the near-term bearish edge. An eventual close above the 20 EMA would hint at a bearish invalidation.
Rationale
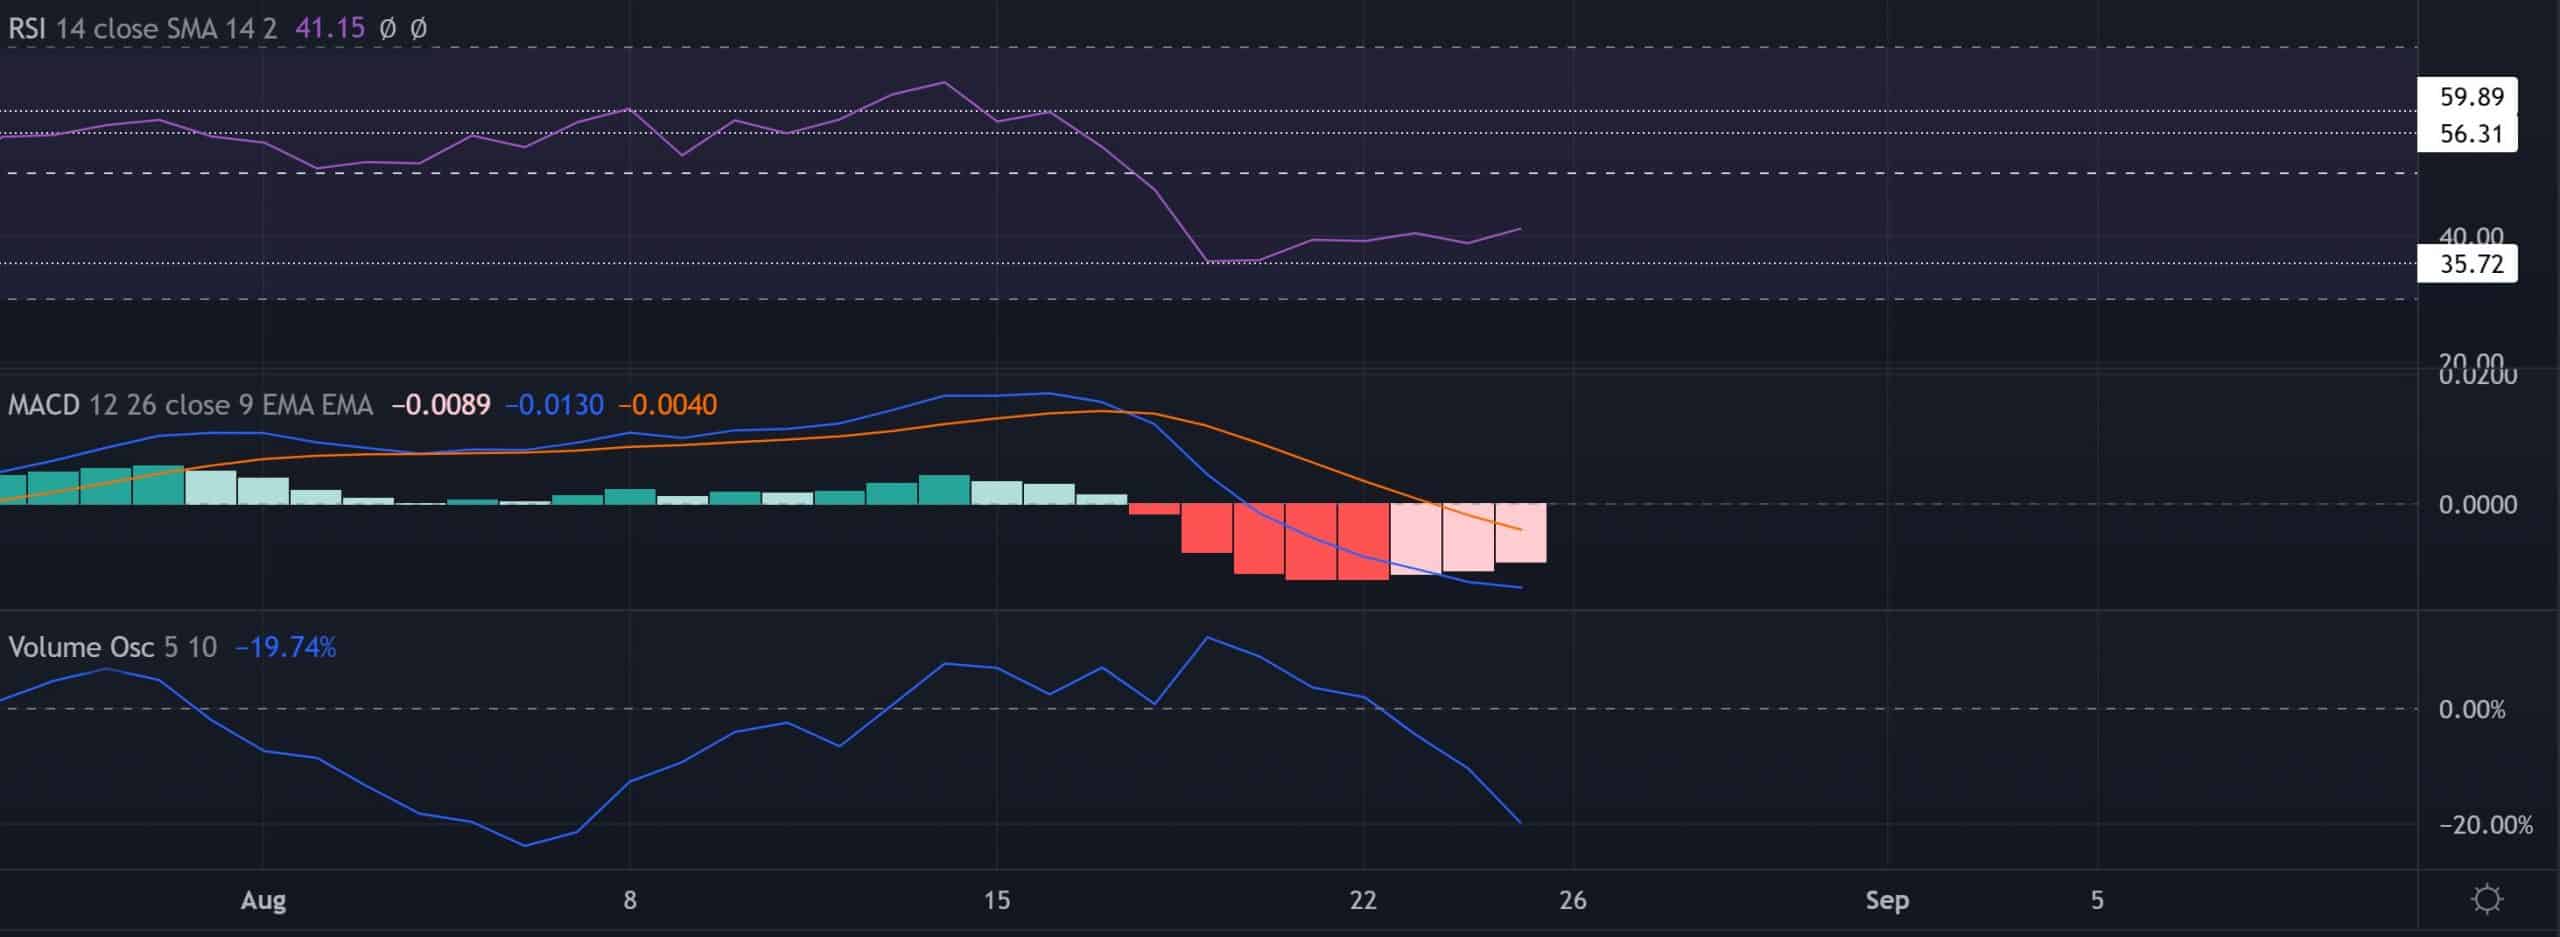
The Relative Strength Index (RSI) insisted on its bearish stance after finding support in the 35-region. The buyers must strive to reclaim a spot above the midline to heighten the chances of a comeback.
Also, the south-looking Moving Average Convergence Divergence (MACD) lines plunged below zero after a month to reveal a robust selling edge. Further, the Volume Oscillator’s drop below the zero level revealed a bearish divergence with the price action.
Conclusion
In view of the bearish flag-like structure forming below the southbound EMA ribbons, the sellers could look to exude pressure. ADA buyers must propel a jump above the 20 EMA to invalidate this pressure. The potential targets would remain the same as above.
Nonetheless, traders/investors should keep a close watch on Bitcoin’s movement and its effects on the wider market to make a profitable move.