
- JUP recorded major selling pressure, with its short-term moving average crossing below the 200-day MA
- RSI signaled bearish momentum, with the indicator approaching oversold territory on the charts
Jupiter (JUP), at press time, was at the end of some major selling pressure on the charts. This selling pressure seemed to have wiped out the modest gains it made over the past week. In fact, the altcoin’s shorter-term moving average had recently crossed below the longer-term 200-day MA, indicating a bearish crossover.
Such crossovers often mean that a downtrend might continue as the shorter-term momentum may be weakening, relative to its longer-term trend.
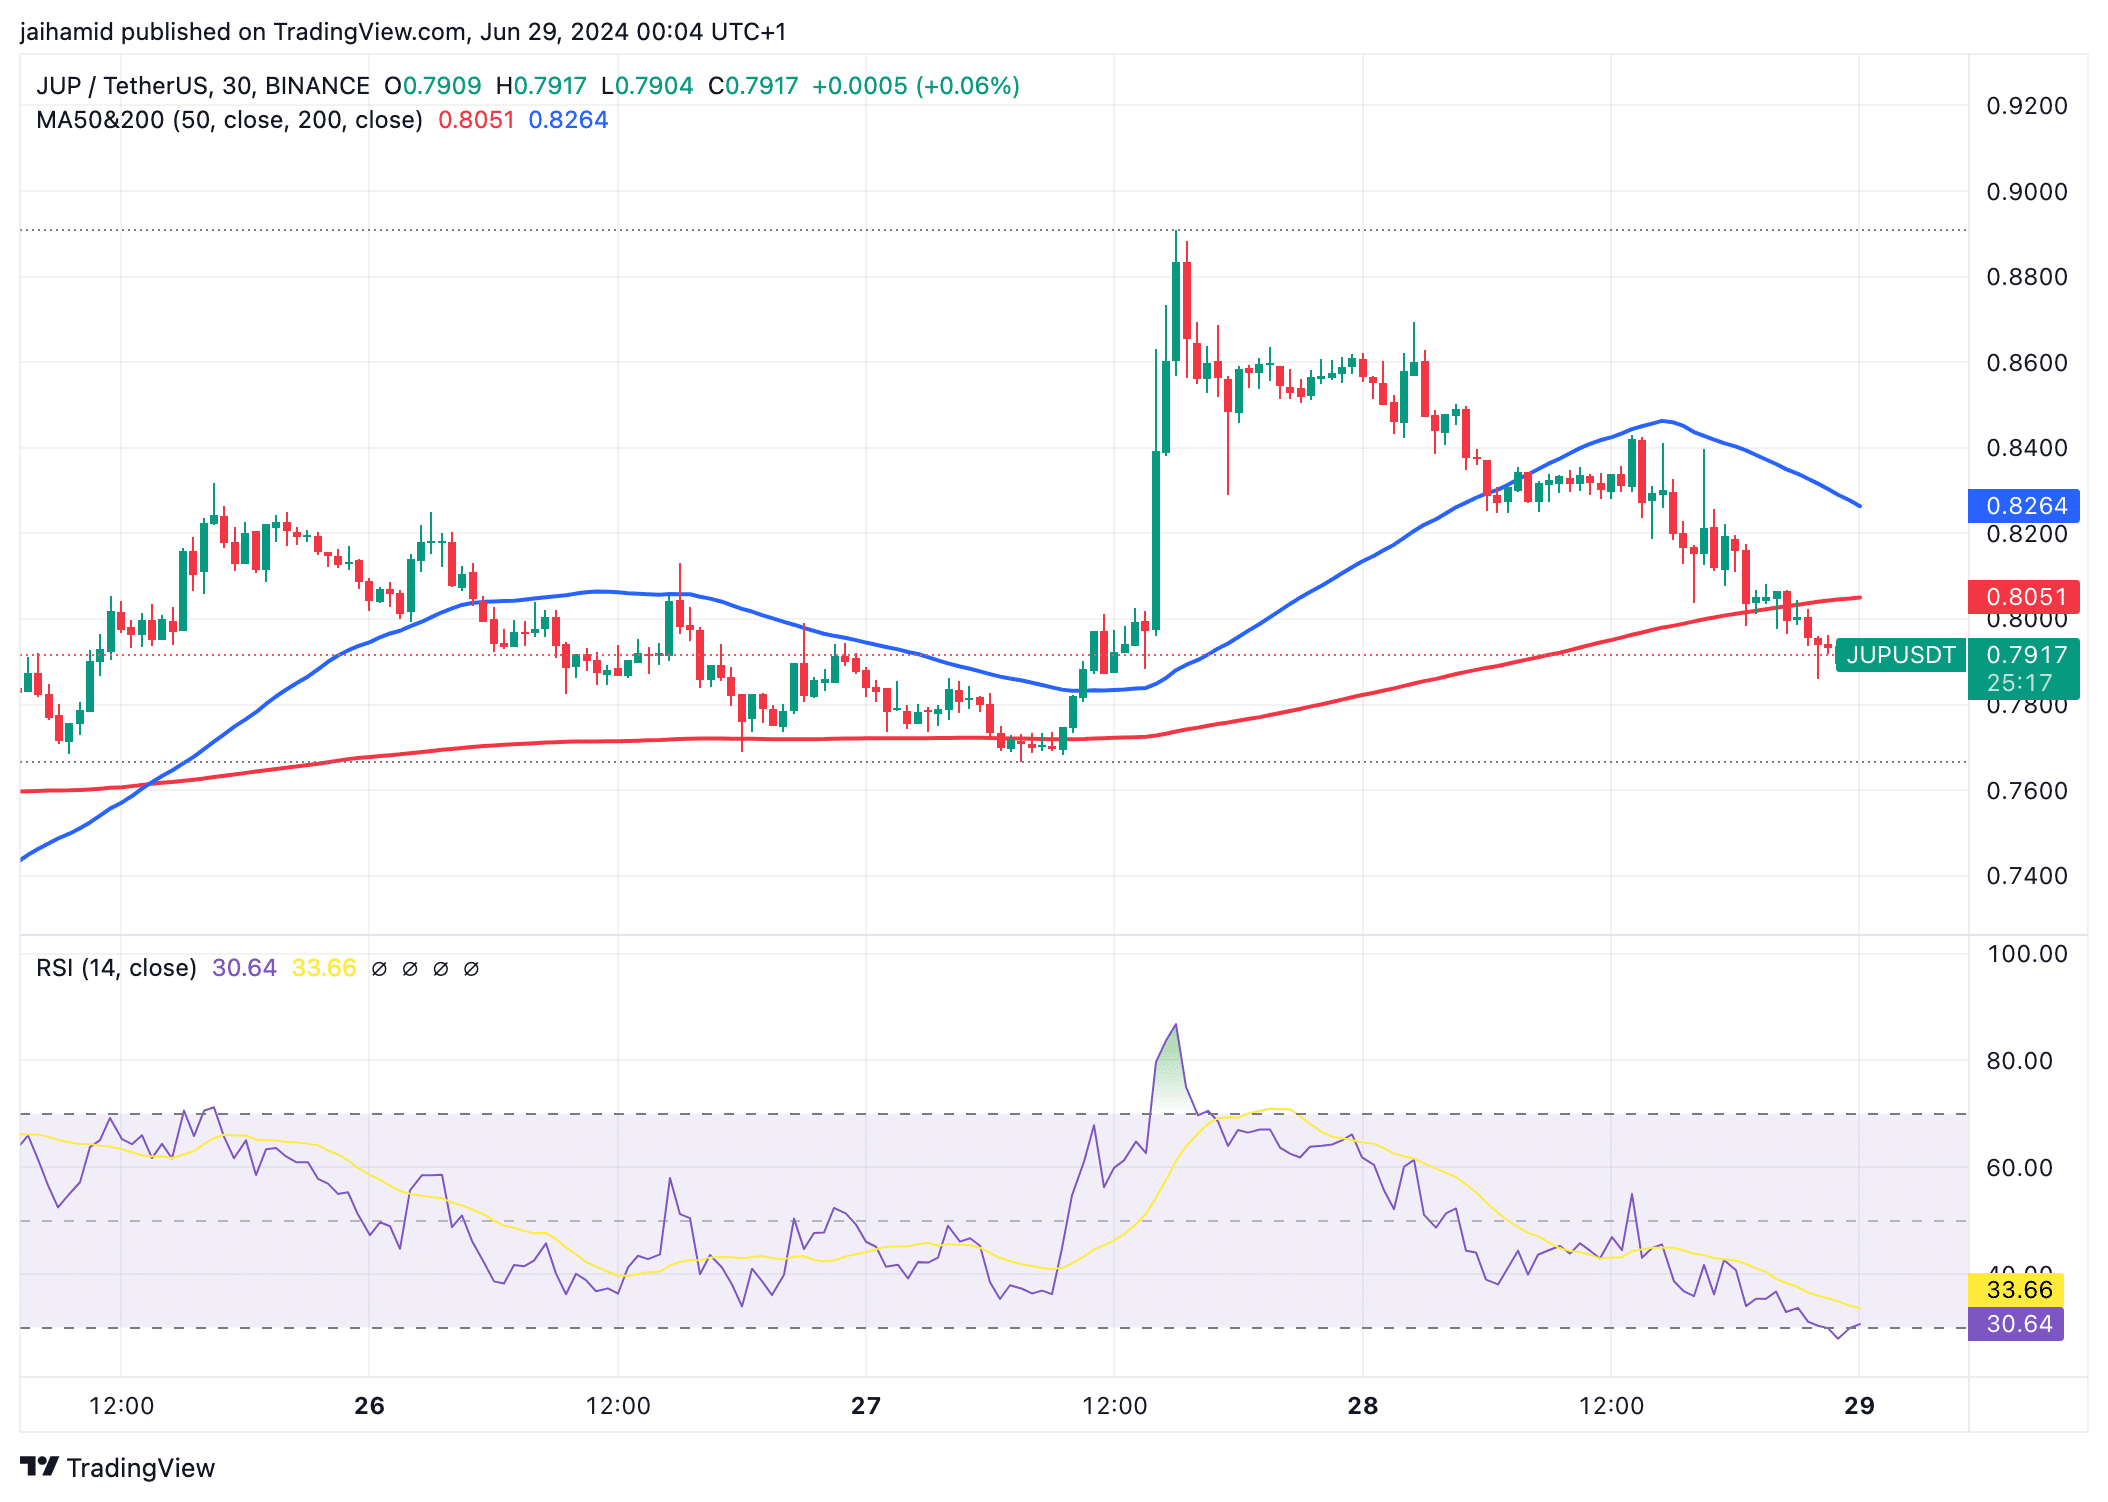
Source: TradingView
Technical indicators highlight downward pressure
The RSI, at the time of writing, was below 40, indicating bearish momentum and approaching oversold territory. An RSI below 30 typically suggests that the asset is becoming oversold, meaning a potential for a price rebound or stabilization if buyers step in.
After a notable spike, which was an outlier, JUP prices have trended downwards, consistently forming lower highs and lower lows – A classical bearish trend.
At press time, the price seemed to be testing the MA50 as a resistance, having dipped below it prior to that. Failure to break above this line could lead to further declines on the charts.
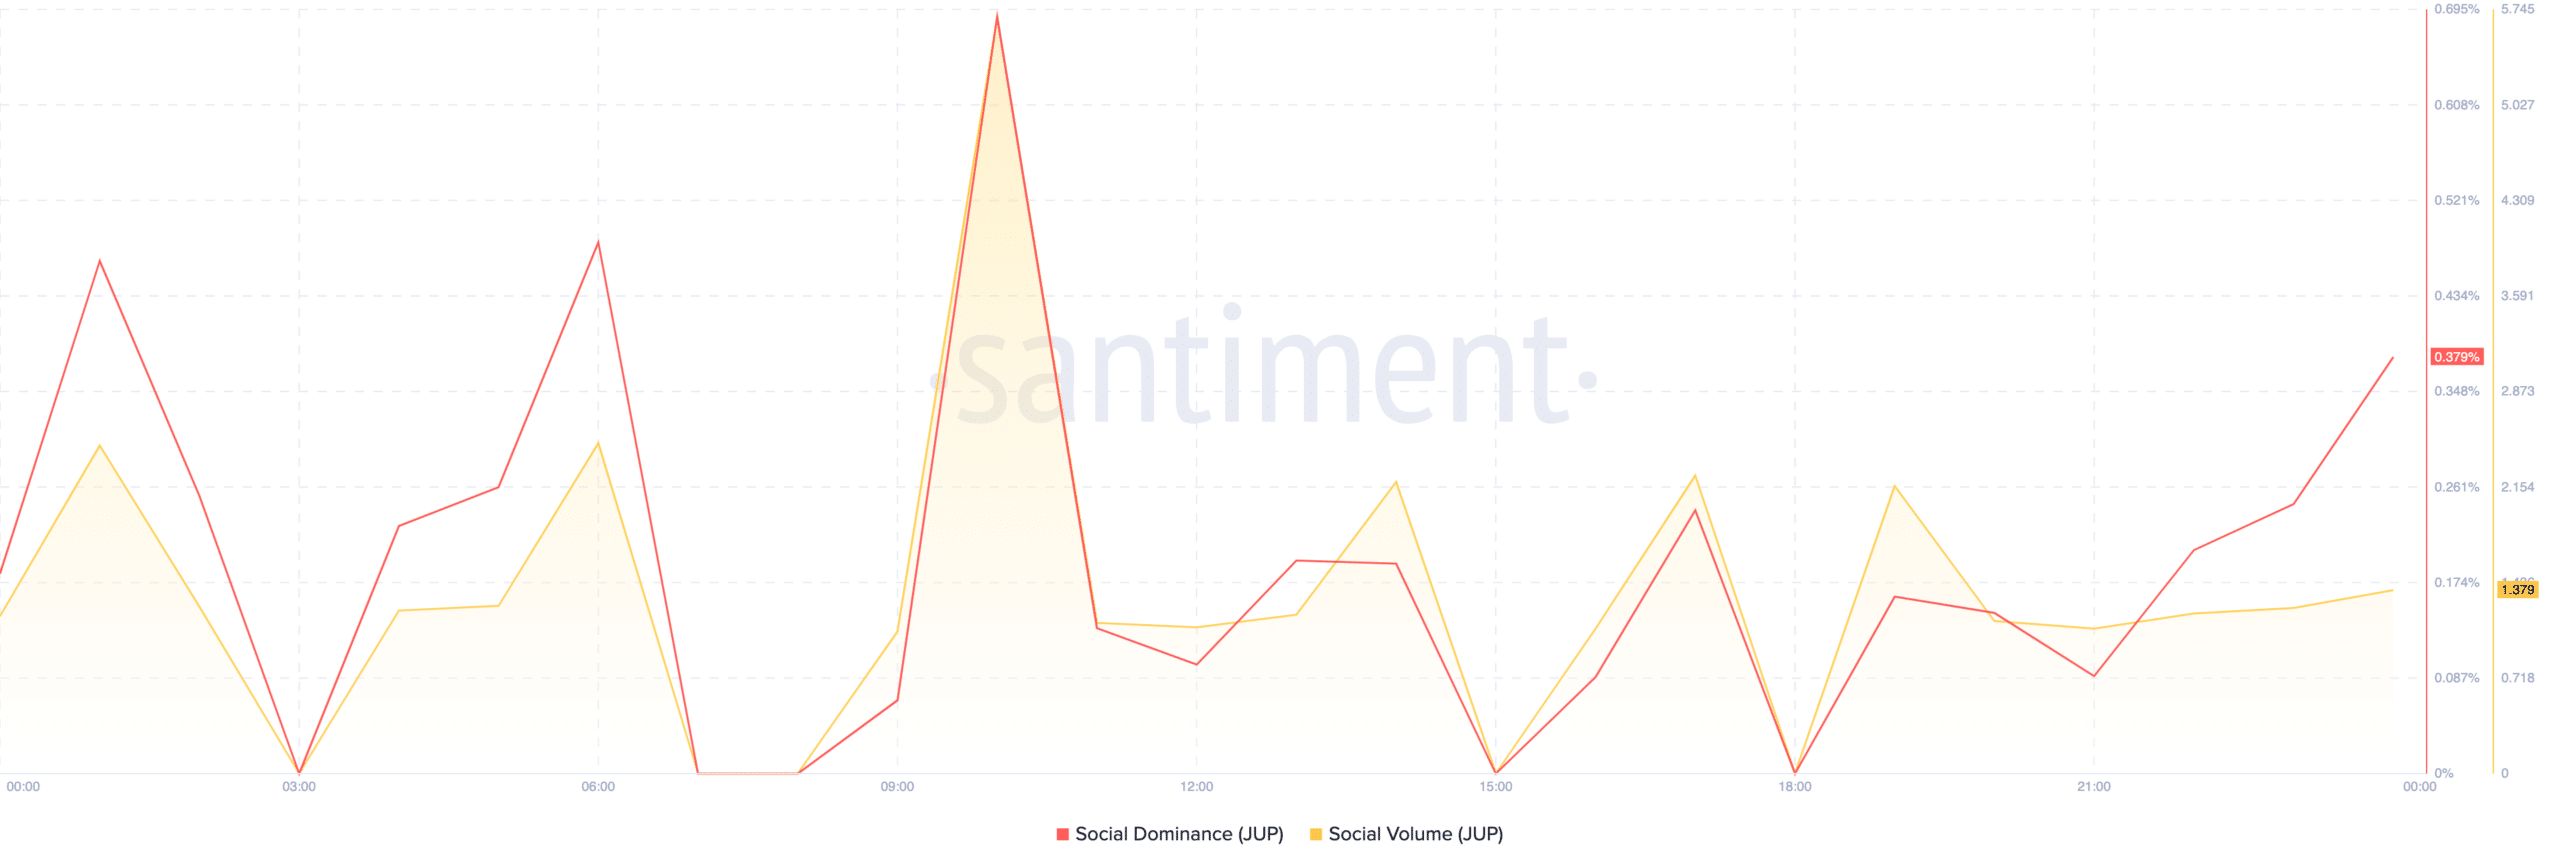
Source: Santiment
There was also a notable peak in social dominance, one that coincided with the peak in social volume. Simply put, JUP’s recent price movements may have been likely influenced by trader reactions to news or market events.
For instance – A double-top was found 21 times with 14 confirmations. This pattern typically signals a bearish reversal after failing to break resistance twice.
Double-bottom was indicated 32 times with 25 confirmations. This pattern typically suggests a bullish reversal after failing to break support twice.
The dominance of double bottom formations might indicate attempts to reverse its market trend. However, given the prevailing market conditions (Price below the Ichimoku Cloud and moving averages), these did not sustain themselves on the charts.
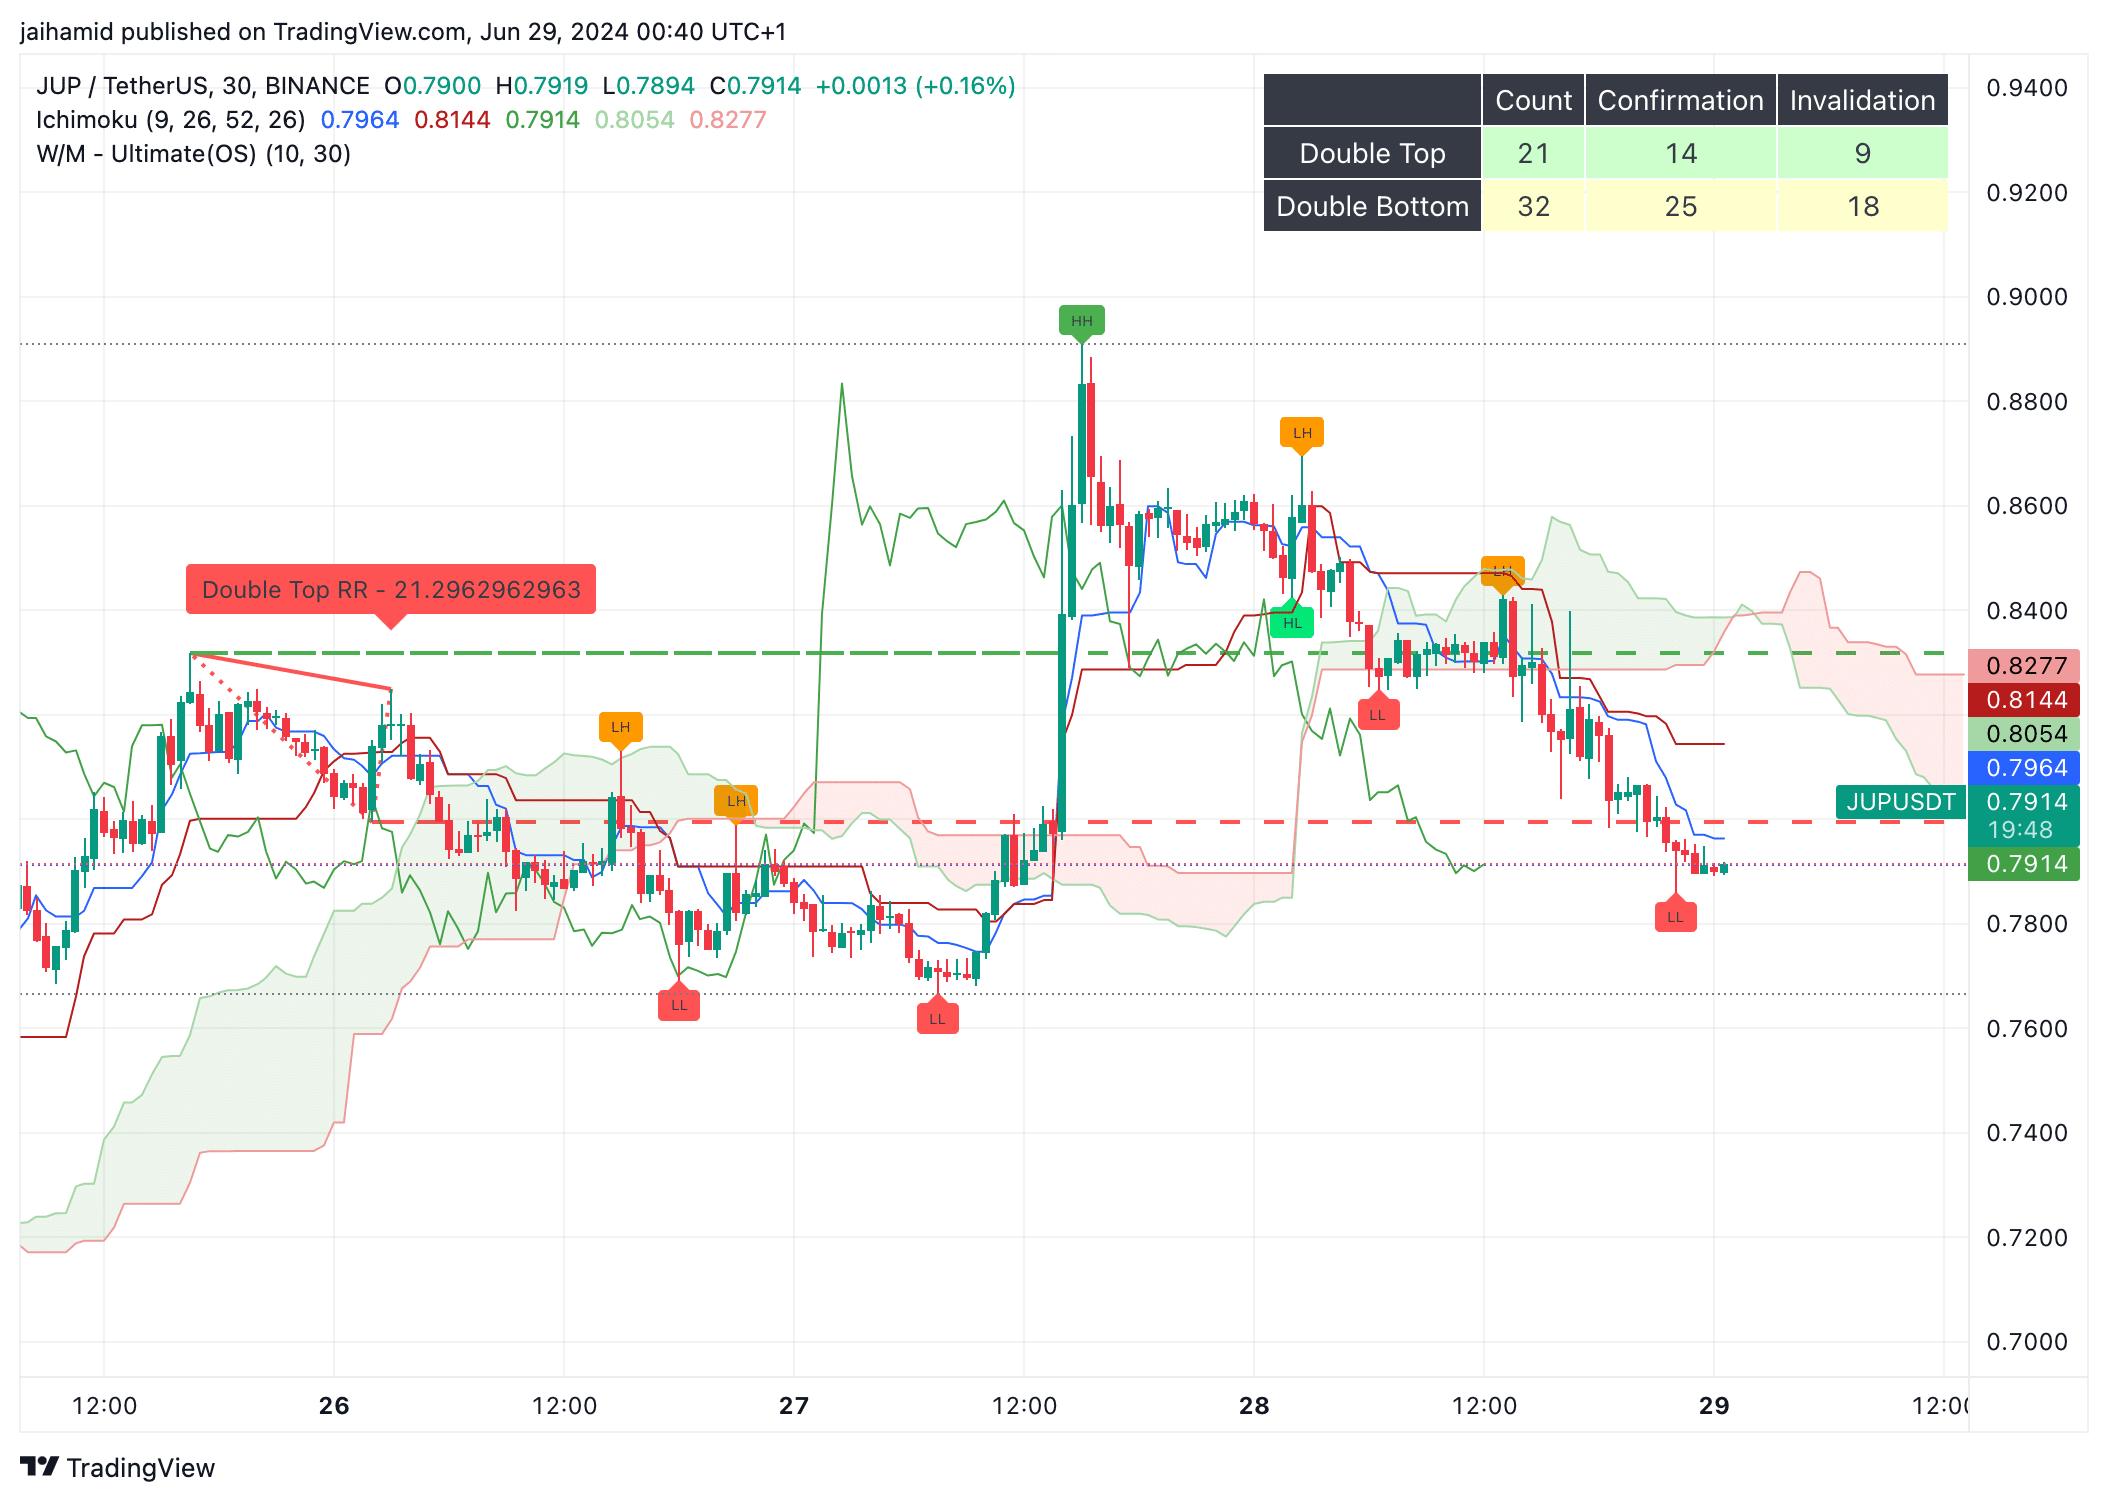
Source: TradingView
Finally, the ultimate oscillator was plotted on the upper part of the chart and measured the momentum. The recent dip in the oscillator corresponded with the price breaking down below its support levels, indicating strong selling momentum.
A huge hike in buying volume could help push the price above its resistance levels, potentially reversing its current downtrend.