How likely is Polkadot to hit the $20-mark

It is fair to say that the global cryptocurrency market has been quite turbulent lately. Since the market suffered an over 60% decline during mid-May, sellers have largely been in control of Bitcoin prices, which has had a domino effect on other alts as well.
While positive developments have spurred buying on several occasions- most notably being El Salvador’s Bitcoin adoption, sellers have promptly responded to any attempts at a wider recovery in the market. The most latest development came out of speculation that Amazon Inc. could soon start accepting Bitcoin as legal tender.
The king coin responded by 10% increase that saw its value climb above $38,000 for the first time in over a month. Polkadot, like most of its counterparts also saw a surge in value and traded at $14.78, up by 8% over the last 24 hours.
Polkadot Daily Chart
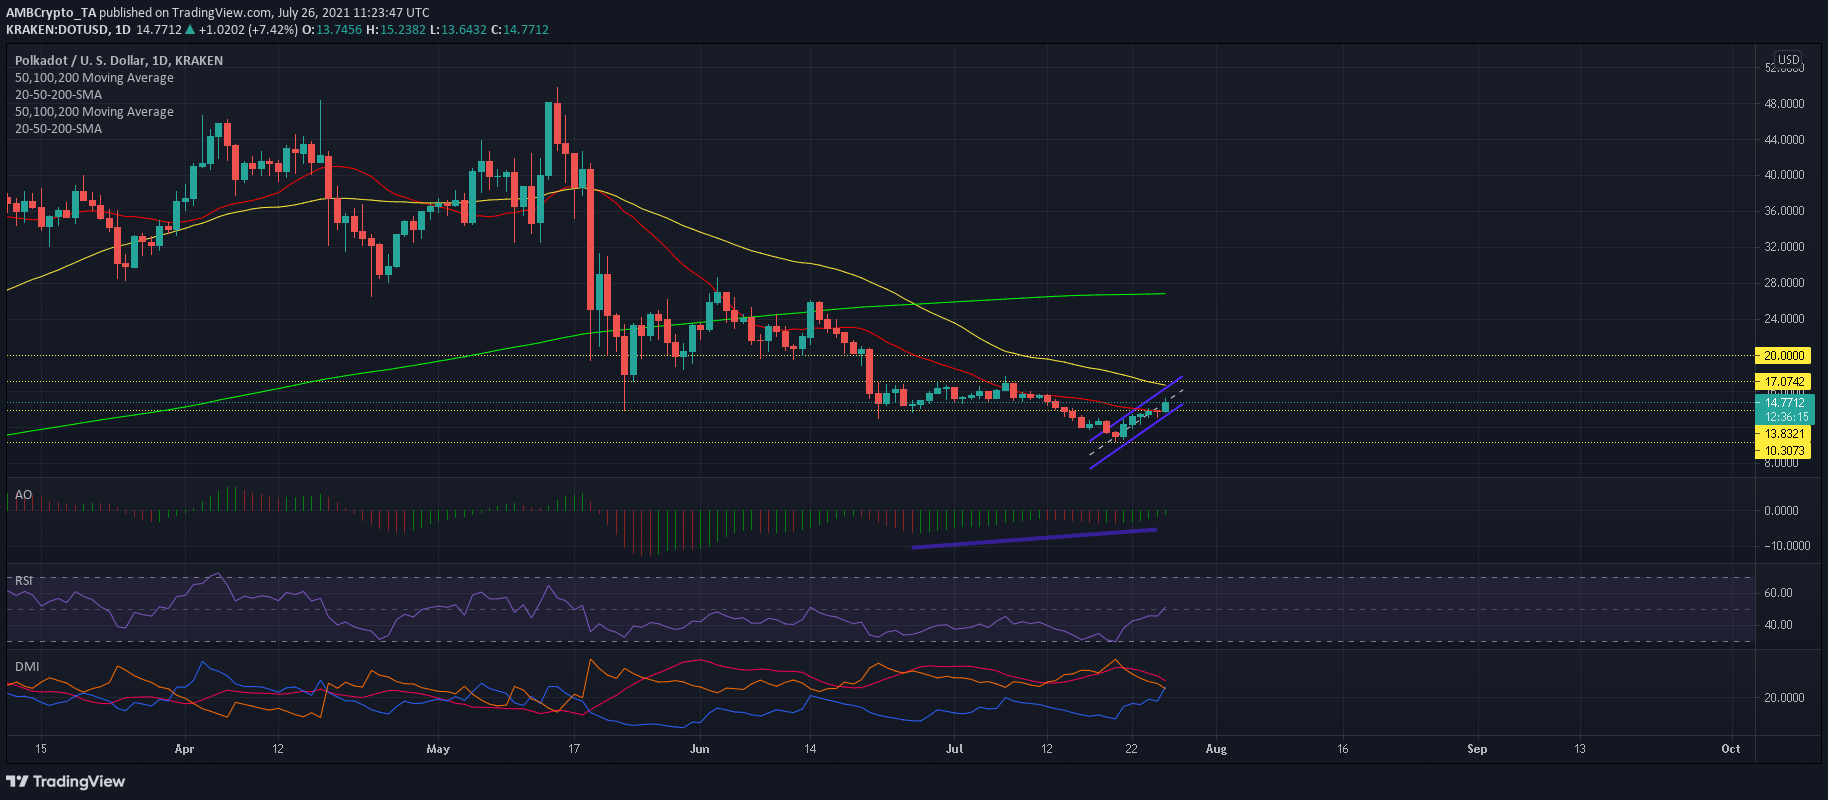
Even before today’s jump, Polkadot has consistently been rising since touching multi-month lows on 21st July. Its latest rise above 23rd May swing low of $13.8 saw prices flip their 20-SMA (red) to bullish after a period of 43 days. The next target for DOT now lay at a resistance zone of $16.4-$17 from where a push towards $20 would be possible.
Bulls in Command?
The Relative Strength Index has been rejected at 50 multiple times during the past few months and was yet to climb above equilibrium. Awesome Oscillator did form a bullish twin peak setup but was yet to climb above the half-mark. Directional Movement Index was also on the cusp on a bullish crossover but the same had not yet been confirmed. All these signs suggested that bulls were the ones making progress although they had not yet assumed full market control.
DOT’s strong correlation of 0.80 with BTC meant that its price would likely mirror BTC’s movement in the coming week. Incidentally, BTC’s daily RSI (not shown) was close to the overbought territory which could result in a correction before the next swing. This would have a similar result for DOT which could move towards a support zone of $13.8-14. From here on, traders must be cautious as a close below $13.8 could trigger an even sharper retracement.
Conclusion
Since DOT bulls were yet to make key developments, an extended rise towards $20 cannot be fully backed just yet. Instead, a minor decline could occur before the next leg upwards and traders must be on the lookout of a close below $13.8 as this could trigger the next sell-off.