How long will BONK struggle? Watch out for these key levels

- BONK momentum was barely bullish and buying pressure was indecisive.
- The liquidation levels showed that prices could be pulled lower in the coming weeks.
Bonk [BONK] endured a rough week, losing 22% from the high on the 22nd of July, but might be turning a corner. It followed Bitcoin’s [BTC] momentum, but the memecoin has maintained its bullish structure since.
Last weekend, it had broken a key resistance and was set to surge higher. This did not happen due to BTC and weak BONK bulls. Would this weekend see the past week’s losses reversed?
BONK prices likely to rebound
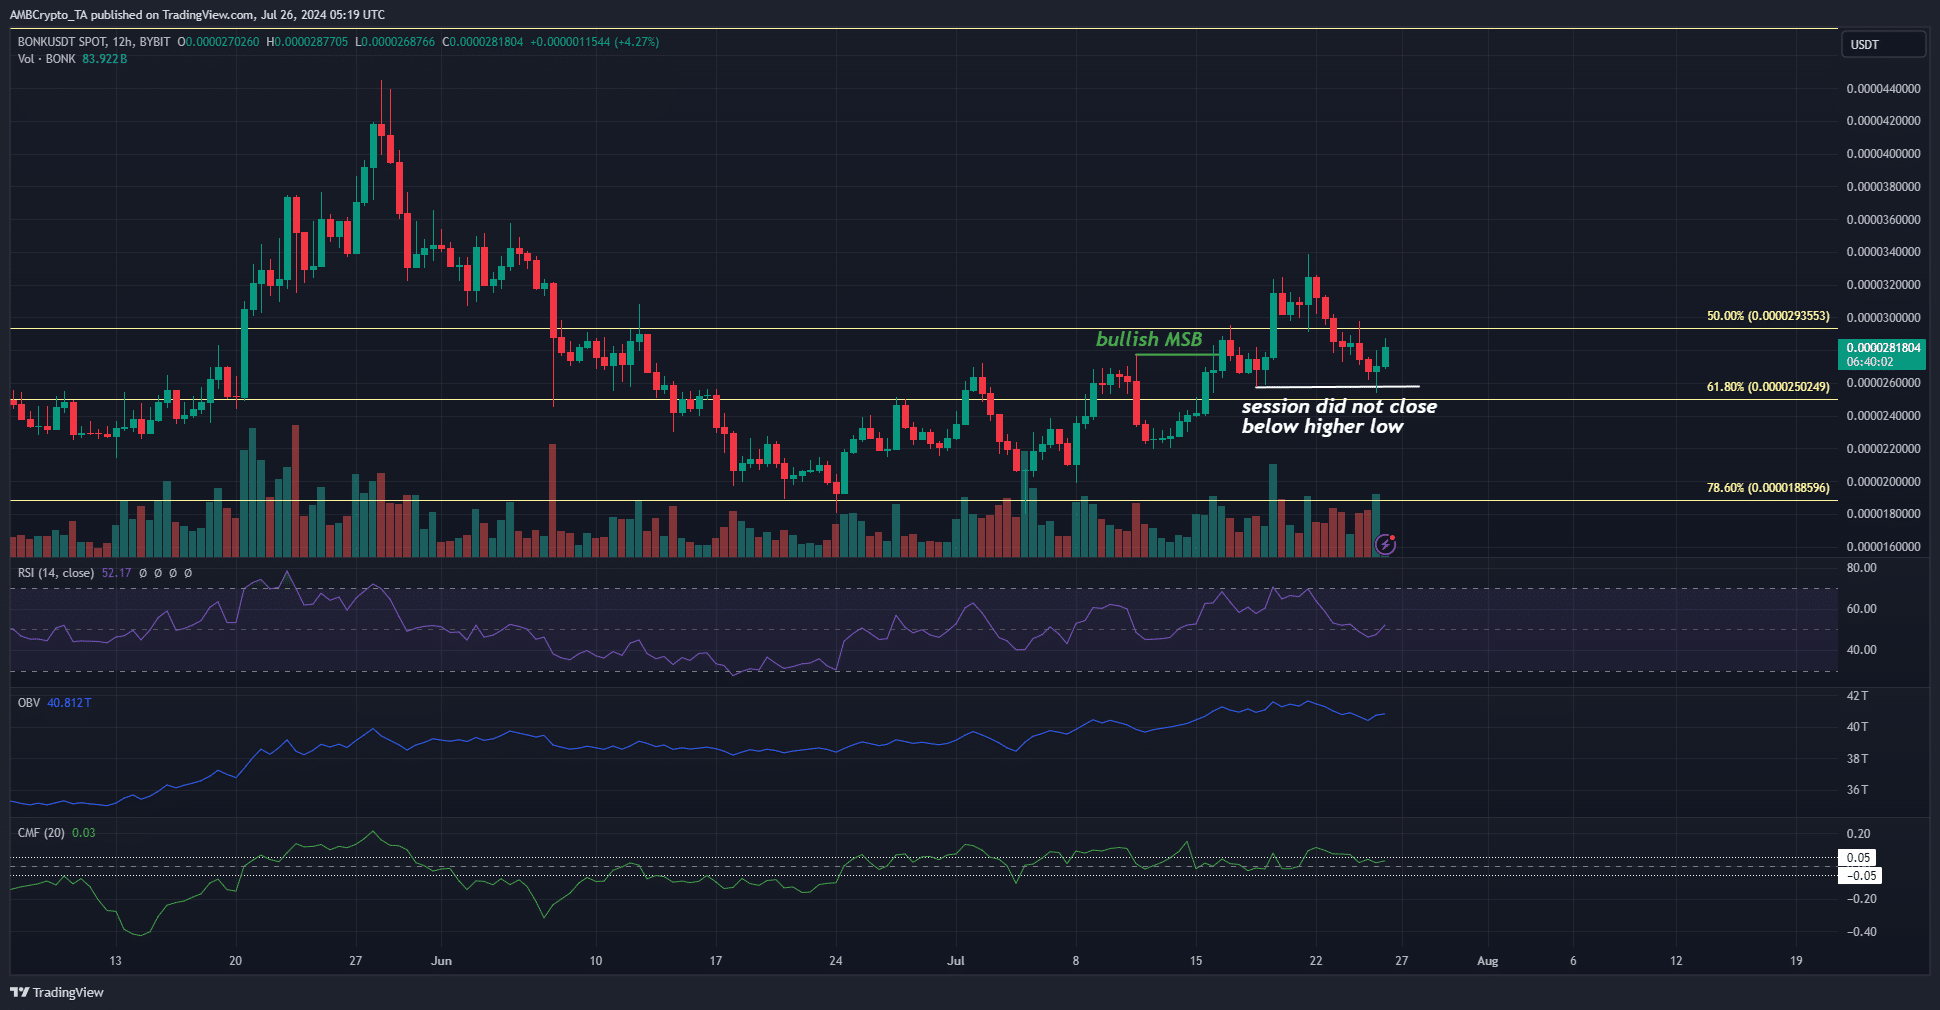
The 12-hour chart showed that the market structure was still bullish. The move past the $0.0000277 was a bullish market structure break. The higher low it set thereafter at $0.0000282 was not broken yet.
A break would be a 12-hour trading session close below this level. Instead, prices have climbed higher from the support level. This could also be because Bitcoin bounced from $64k to $67.1k at press time, a 4.7% rise.
The CMF was at +0.03, showing a lack of significant capital inflows. The RSI was at 52, but the momentum was indecisive. The OBV saw a pullback over the past week but has trended upward in July.
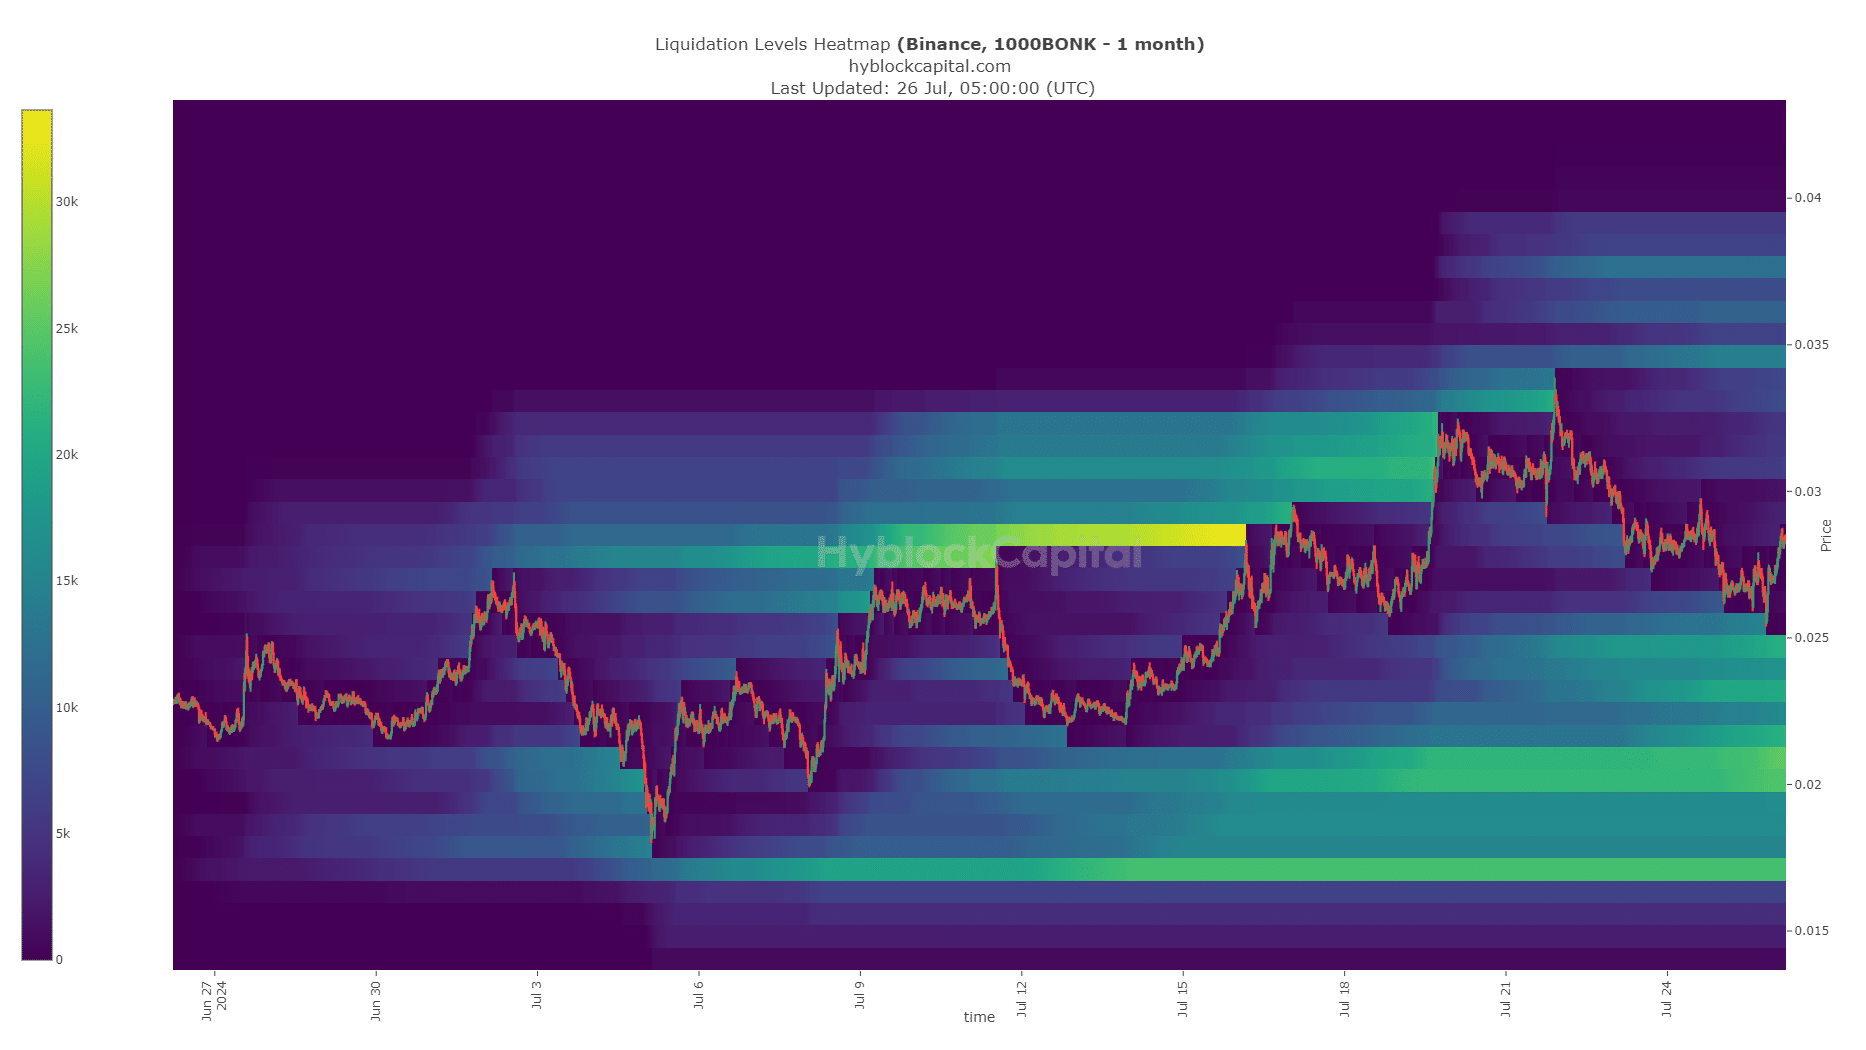
Liquidation heatmap warns of a potential downturn

Source: Hyblock
The $0.000025 liquidity pool was swept and prices have bounced higher. However, there was a larger concentration of liquidity at $0.00002 and $0.000017.
Realistic or not, here’s BONK’s market cap in BTC’s terms
If the market structure turns bearish, these would be the next price targets.
Overall, BONK has a bullish outlook. The indicators were reset to neutral after the losses over the past four days. If Bitcoin faces a reversal in the $69k area, BONK is likely to follow and shed its gains.
Disclaimer: The information presented does not constitute financial, investment, trading, or other types of advice and is solely the writer’s opinion.


