How XRP’s next ‘test’ will set it up for the next week

Disclaimer: The findings of the following analysis are the sole opinions of the writer and should not be considered investment advice
After its latest bullish rally, XRP broke out of its down-channel (yellow) and entered the $0.75 to $0.82 range. However, it still stayed below its 200 EMA (yellow), maintaining its long-term view as a downtrend.
As the month-long supply zone stands firm, XRP will eye a test of its trendline support near the 20 EMA (red) and continue its squeeze phase before a possible breakout.
At press time, XRP was trading at $0.806, down by 1.31%in the last 24 hours.
XRP daily chart

Since reversing from the $1.3-level, XRP fell within a three-month-long down-channel (white) until breaking out from it in early February. As it fell below some critical supports (now resistances), the alt hit its 11-month support at the $0.6-level.
Since then, it has registered a 55.08% ROI between 3 and 8 February as it formed a bullish flag and broke out of its down-channel (white). Over the last three months, the immediate trendline support (white, dashed) has offered strong support for the buyers. Thus, enabling the recovery of its 20 EMA above the 50 EMA (cyan).
Now, with the bears keen on rejecting higher prices above the $0.82-mark for the last month, XRP could see a near-term drop towards the $0.77-level. Following the same, while the 20 EMA kept rising above the 50 EMA, the bulls would most likely take over and propel another rally towards its 200 EMA.
On the flip side, any gradual fall below its 20/50 EMA would open up chances for a patterned breakdown.
Rationale
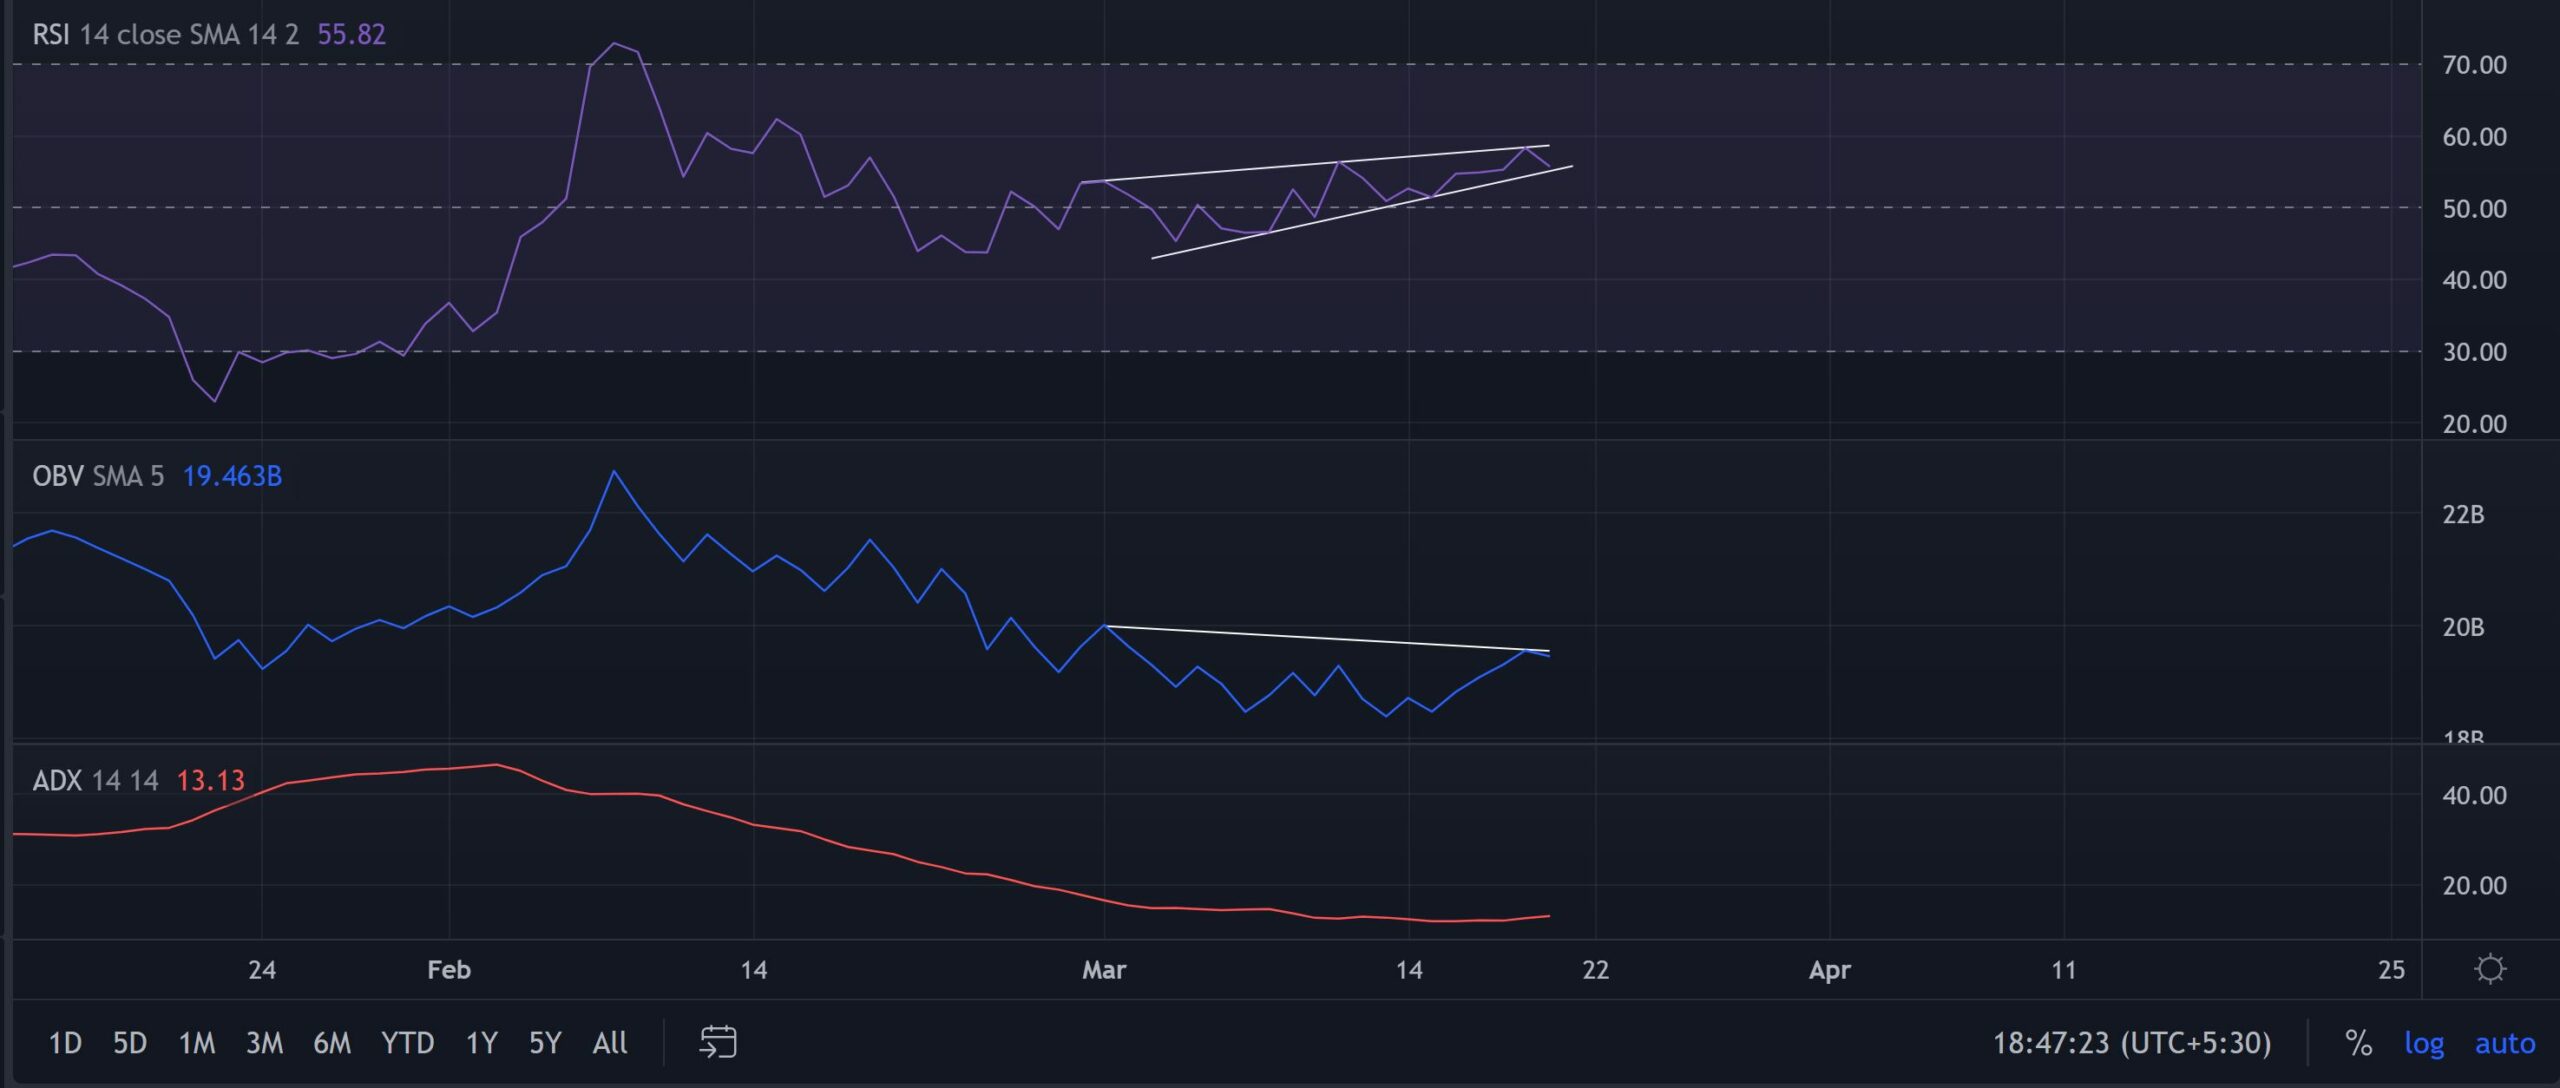
The bullish RSI has corresponded with the price for the most part as it grew in a rising wedge (white) above the midline. Now, defending the lower trendline support of the wedge is crucial to prevent a fall towards the 50-mark.
Further, the OBV pictured lower peaks over the past month while the price diverged with the indicator. This revealed the underlying bearish tendencies. Nevertheless, the ADX flashed a weak directional trend for XRP.
Conclusion
With the recent decrease in trading volumes and a bearish divergence with the OBV, XRP braced itself for a test of its Point of Control (POC, red) before continuing its patterned oscillation. Any close below the $0.77-$0.75 range would affirm a selling signal.
Additionally, keeping an eye on Bitcoin’s movement and the broader sentiment would be important to complement the aforementioned analysis.