Identifying the caveat to AXS’s potential rally on the charts

Disclaimer: The findings of the following analysis are the sole opinions of the writer and should not be considered investment advice
Since losing the $91-mark, Axie Infinity (AXS) has swiftly declined while forming a bearish trendline resistance (white, dashed). In doing so, it pierced through vital price points.
A reversal from the 20 EMA (red) would confirm a hidden bullish divergence, one that would set AXS up for a test of the $53-mark. The trendline resistance is an important area of value to determine the crypto’s future trajectory.
At press time, AXS was trading at $51.52.
AXS 4-hour chart
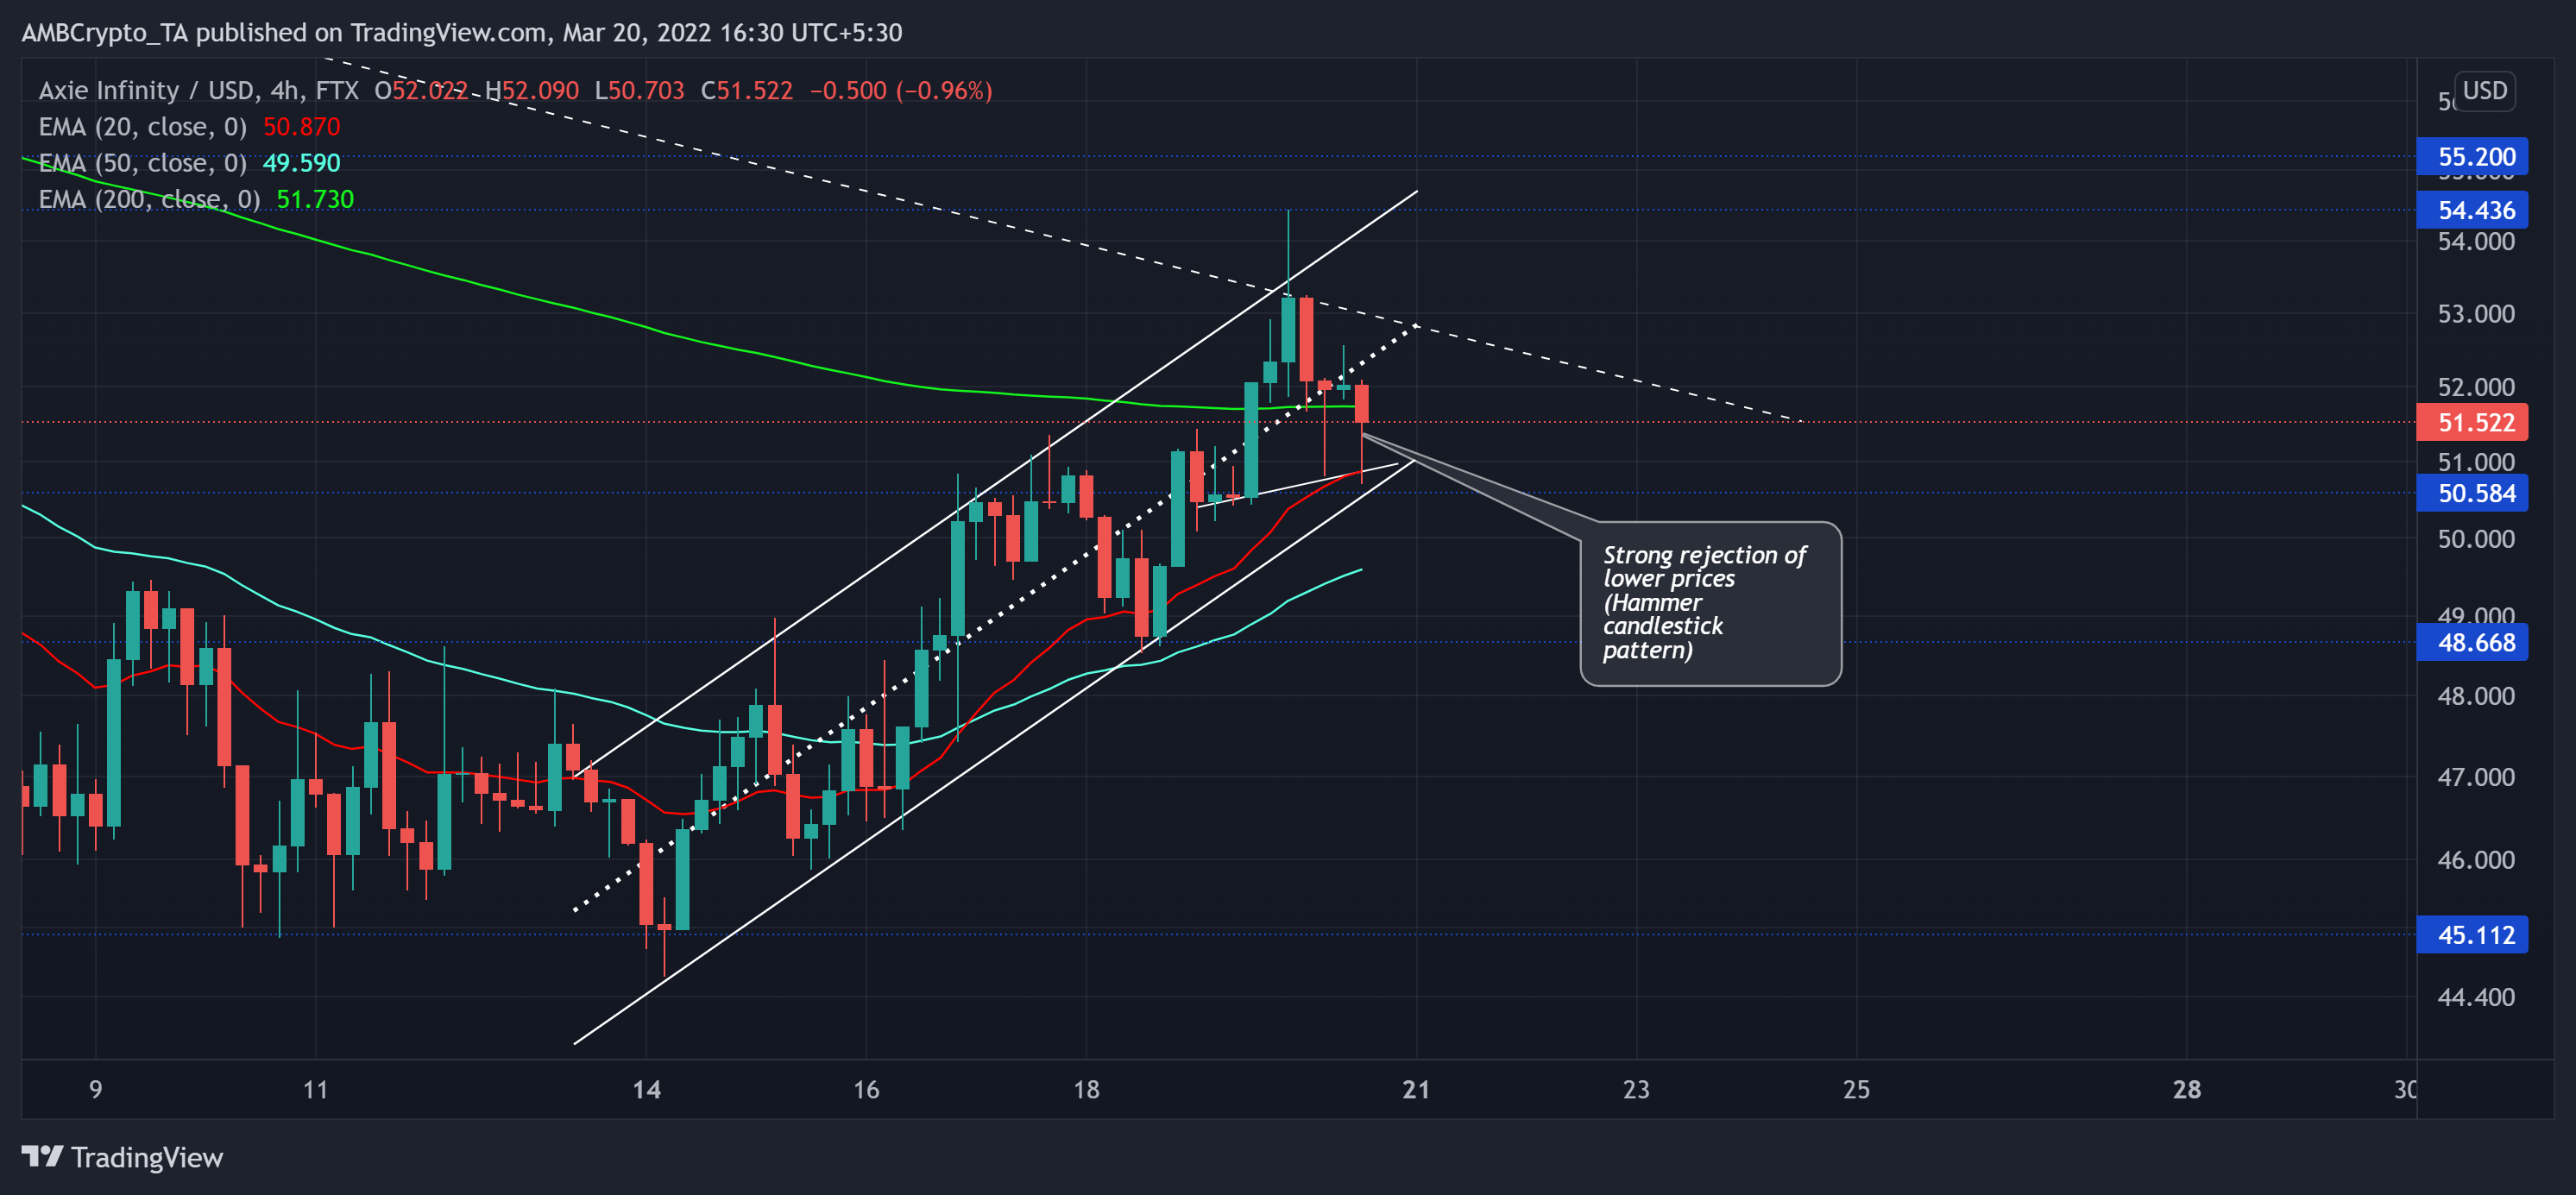
The retracement phase saw multiple down channels (white) on its 4-hour chart as the alt lost nearly 74.4% of its value (Since its ATH) and touched its six-month low on 24 February.
Throughout its fall, the crypto snapped through vital support levels (now resistance) while upholding the $42.1-mark. Consequently, AXS has seen gradual recovery since. The latest rally marked an up-channel (white), one that faced a barrier at the two-month-long trendline resistance.
Now, a sustained close above the 200 EMA (green) would brace the alt for a test of its trendline resistance. Following this, it could see a pullback towards its 20 EMA before continuing its bullish rally. Over the last few days, AXS has faced strong rejection of lower prices as buyers are keen on capitalizing on the improved sentiment.
As a result, the gap between the 20 EMA and 200 EMA has declined while the bulls keep boosting their vigor.
Rationale
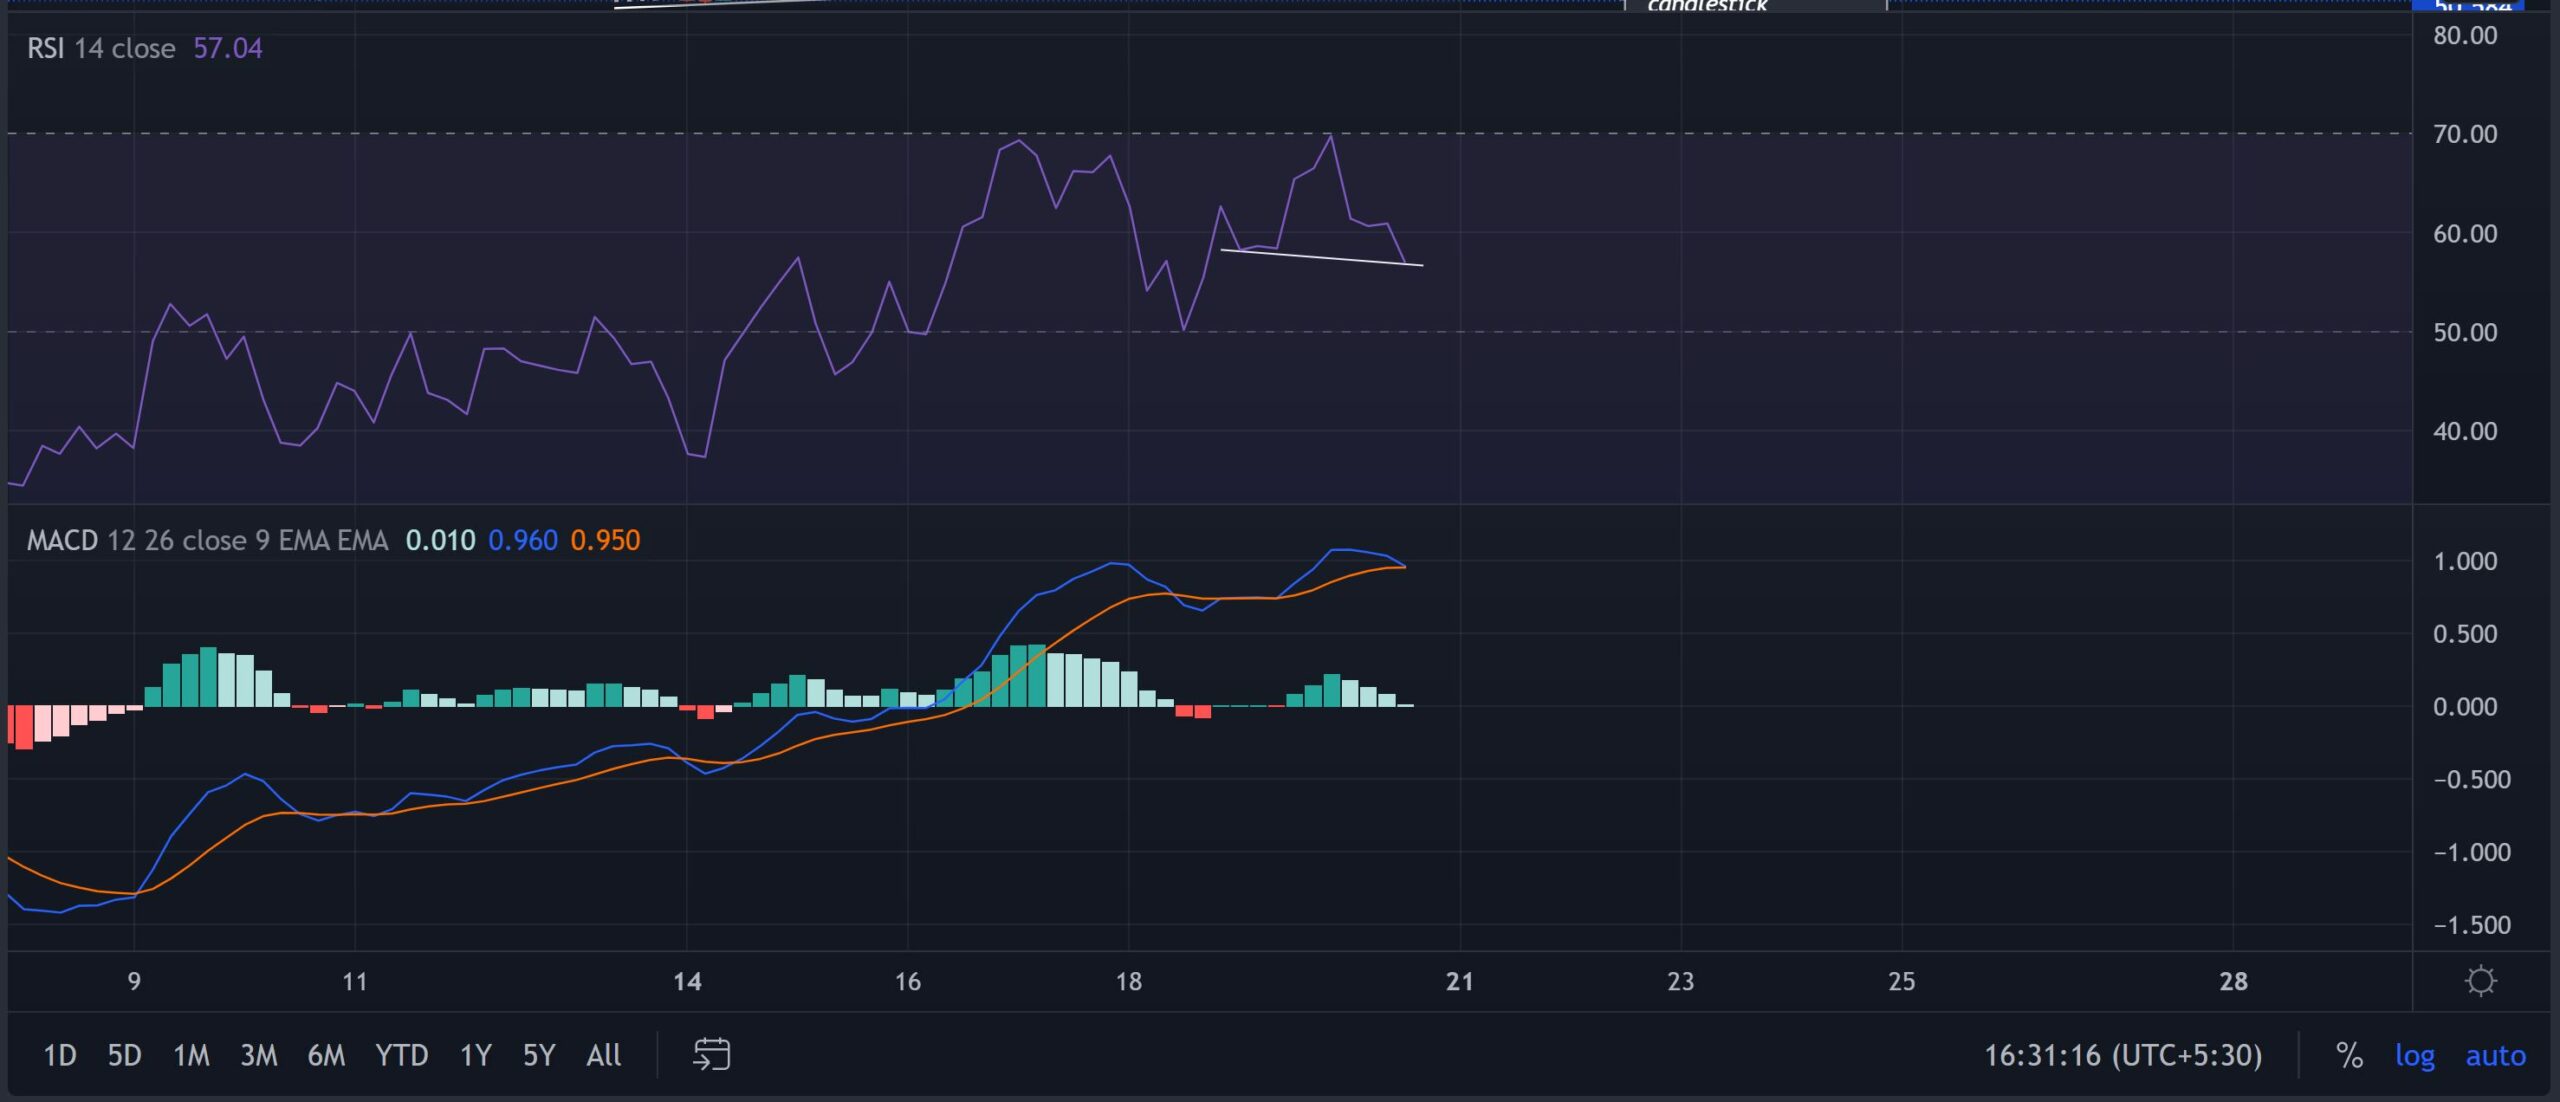
After touching the overbought mark, the RSI saw a steep fall in the last 24 hours. Now, as it eyes a test of its immediate trendline support, any close above this support would reaffirm a hidden bullish divergence with the price. So, the bulls need to defend this level to enable near-term recovery.
The MACD depicted a bullish edge as its lines swayed above the zero line. A potential bearish crossover could lead to a near-term setback for bulls.
Conclusion
Considering the recent buying pressure and rejection of lower prices, AXS aims to test the $52-mark before a possible pullback. Any close above the trendline resistance could lead to a trend-altering rally. Besides, the alt shares an 68% 30-day correlation with Bitcoin. Thus, keeping an eye on Bitcoin’s movement would be essential towards making a profitable move.