Injective crypto surges 25% – Can INJ confirm a breakout above $9.60?
Long-term investors will want to see prices climb past $13.575 comfortably before looking for signs of a long-term trend shift.


Injective [INJ] has rallied 25% in 24 hours, is up 30% in a week, and is up just over 70% over the past month. AI and big data tokens have seen a strong performance in the past 24 hours, CoinMarketData showed, with the entire sector up 8.87% in a day.
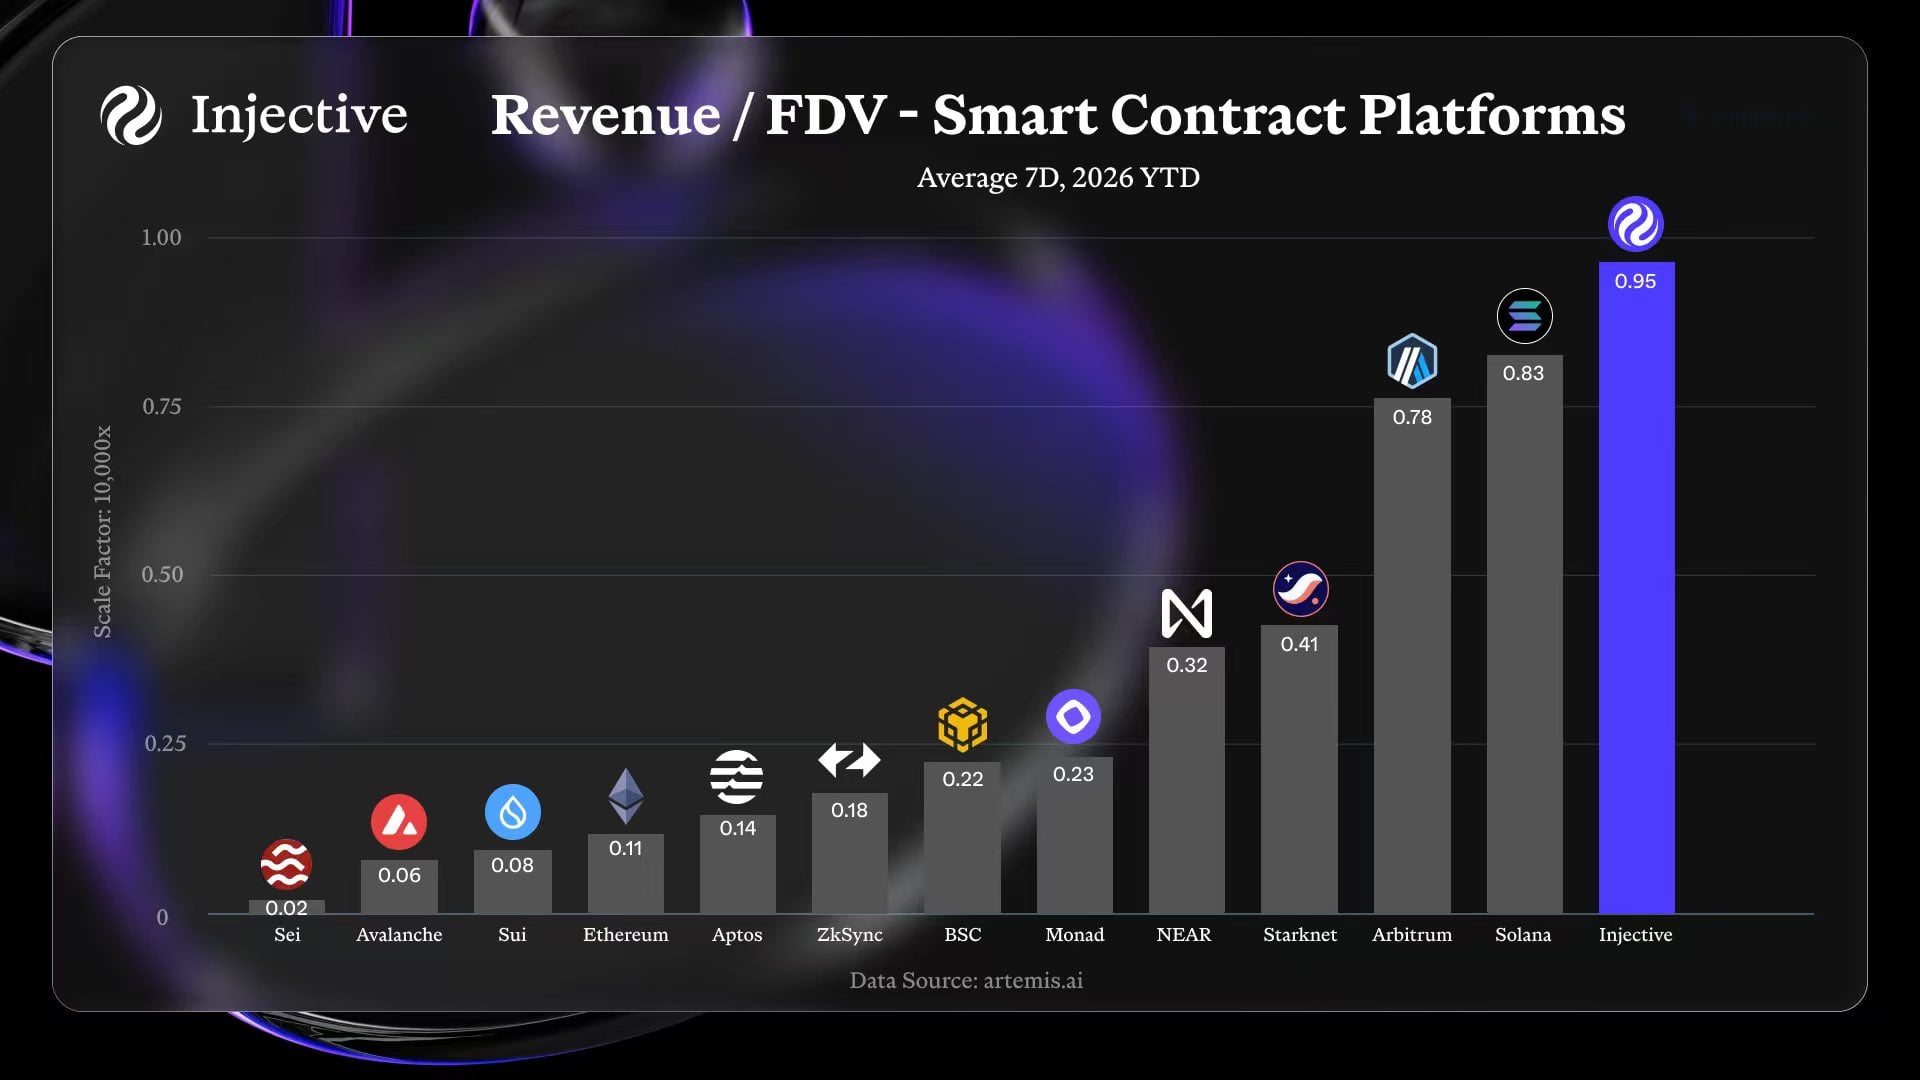
The Injective crypto revenue/fully diluted value ratio was 20% above Arbitrum [ARB] and also led Solana [SOL], the Layer 1 blockchain, as shown in a post on X.
It was over 8x higher than Ethereum [ETH], too. Revenue/FDV is “one of the clearest measures of whether a network’s valuation is backed by real usage,” the post read.
This on-chain revenue flows into the INJ community buyback program, removing INJ supply each month and aiding token scarcity.
News of the Gulf Labs partnership helped boost Injective crypto token prices, and bullish derivatives trading data solidified the short-term sentiment as bullish.
Injective crypto challenges long-term bearish order block
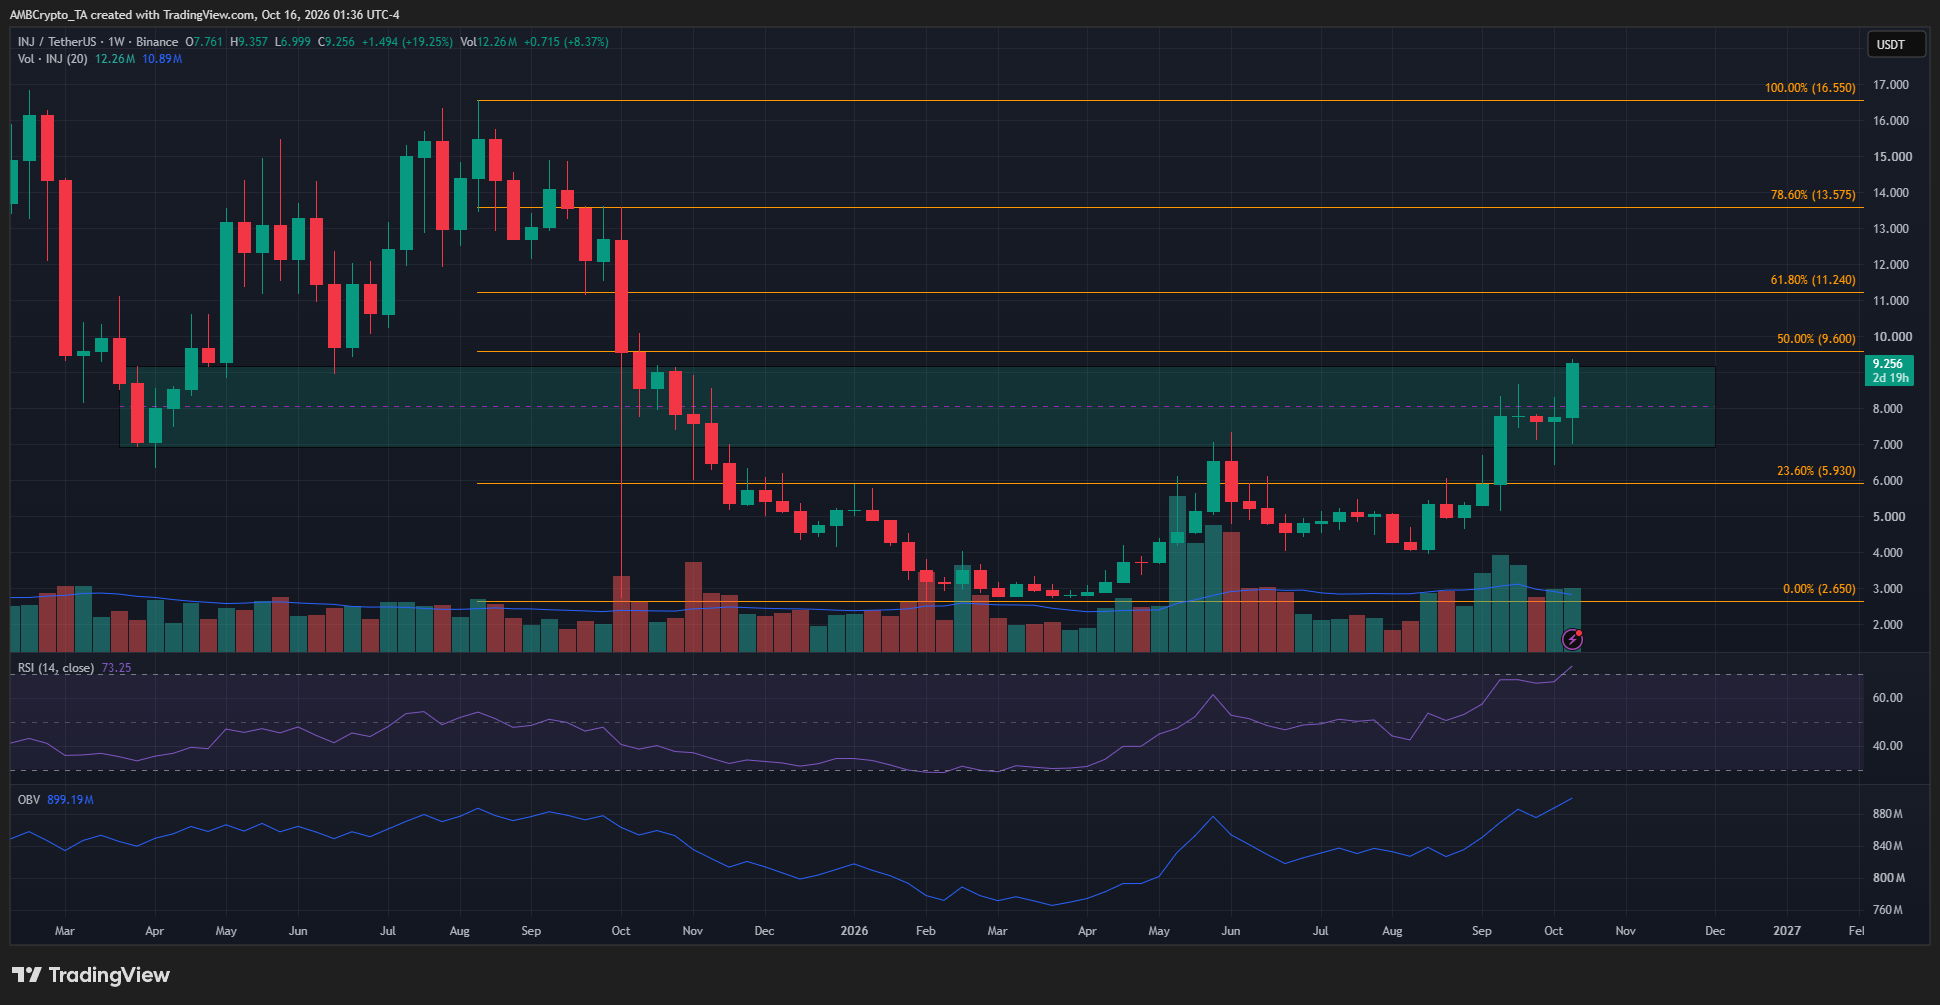
Technically a bearish breaker block, the $6.93-$9.17 area was an area of supply that stretched back to November. It briefly served as a demand zone during the October sell-off, but Injective crypto prices fell to new lows early in 2026.
At the time of writing, this breaker block on the weekly timeframe was being tested. Additionally, the swing move down from $16.55 to $2.65 has its 50% level at $9.6. The other retracement levels overhead at $11.24 and $13.57 are the next swing resistances to watch.
Is Injective crypto on track for a bullish breakout?
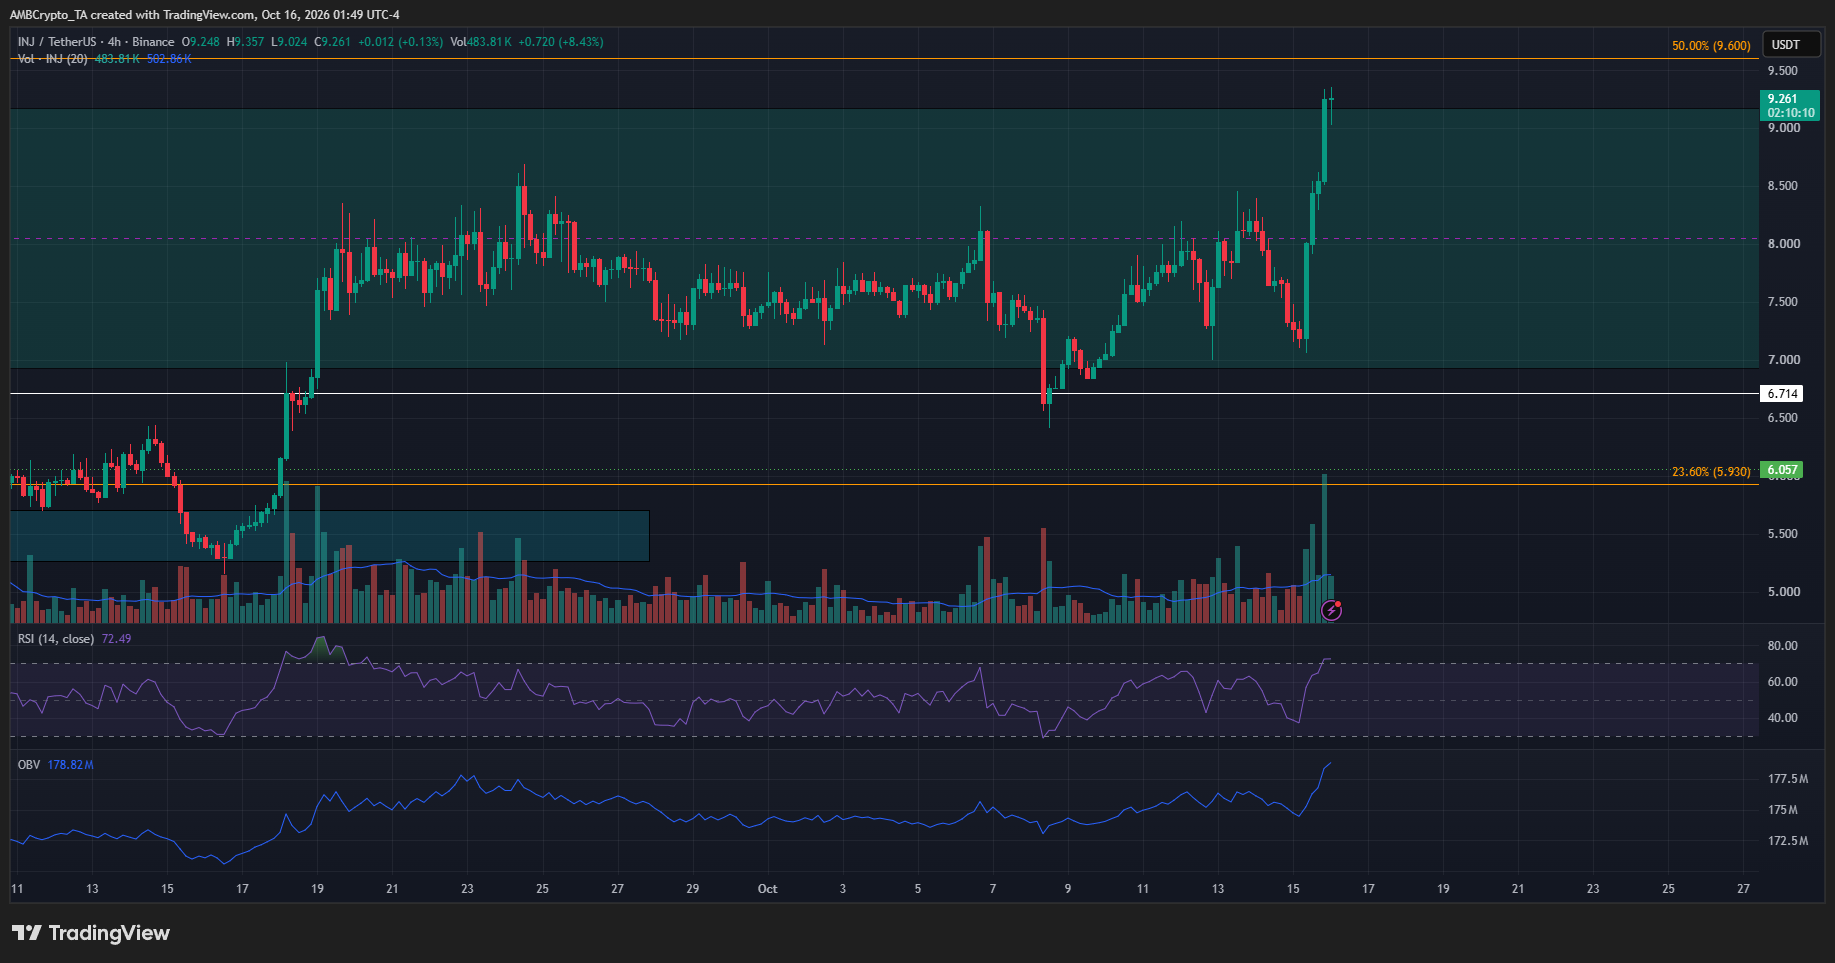
A weekly session close above $9.60 would be a good sign of a bullish continuation. In the lower timeframes, such as the H4 above, the breakout past $8.50 was also a sign of bullish intent.
Notably, the OBV continued its uptrend that began in early September, and the trading volume in recent sessions was well above the 20-period Moving Average. Additionally, at press time, the RSI was at 72, indicating strong bullish momentum.
Swing traders can wait for a pullback toward $8.50 to buy. Long-term investors will want to see prices climb past $13.575 comfortably before looking for signs of a long-term trend shift.
Final Summary
- Injective crypto has rallied 25% in a day on the back of strong spot and derivatives demand for the altcoin.
- The high revenue/FDV ratio and the Gulf Labs partnership exploring tokenization have helped set up the bullish breakout.