
- INJ surges by 18% on weekly charts.
- Recent gains leaves an analyst predicting a new ATH of $100.
Over the past month, crypto markets have experienced extreme volatility. While most altcoins have made moderate gains as Bitcoin [BTC] hits past $64k, others lag. Amidst this volatility, Injective [INJ] was not exceptional.
However, over the past seven days, INJ has made significant gains to trade at $21.77. This makes an 18% increase on weekly charts.
Prior to these gains, INJ was on a downward movement from July 24 that finally came crashing with the October 5 market crash hitting a low of $13.5.
Despite the recent gains, the altcoins remain significantly low from the yearly high of $52.6. Thus, these recent gains, have left analysts and traders aiming for a sustained rally to a new all-time high.
Inasmuch, Crypto Faibik, a popular crypto analyst posits that INJ is currently positioned to make a new ATH.
Prevailing market sentiment
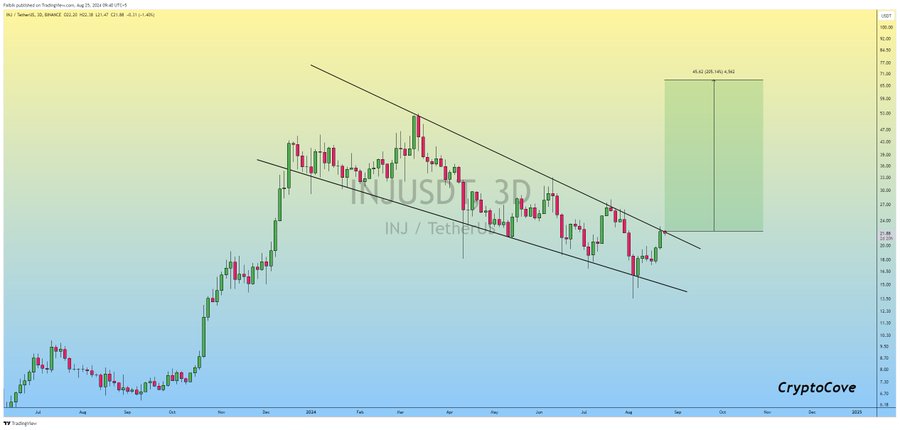
In his analysis, CryptoFaibik sees that INJ is set to break from the falling wedge. According to the analysts, a breakout from this pattern which strengthen the altcoin to make a new record price.
Source: X
Through the X page, the analyst shared his analysis stating that,
“INJ is finally on the verge of a Falling Wedge Breakout. Once the Falling Wedge successfully breaks out, it could hit the $100 mark in Q4.”
This means that while Injective has been declining in the recent past, the current conditions and price movements prepare the altcoins for historical gains.
What INJ price charts indicate
CryptoFaibiki price analysis predicts the altcoin will reach a new all-time high after recent movements. The question is do other metrics support this analogy?
Source: Tradingview
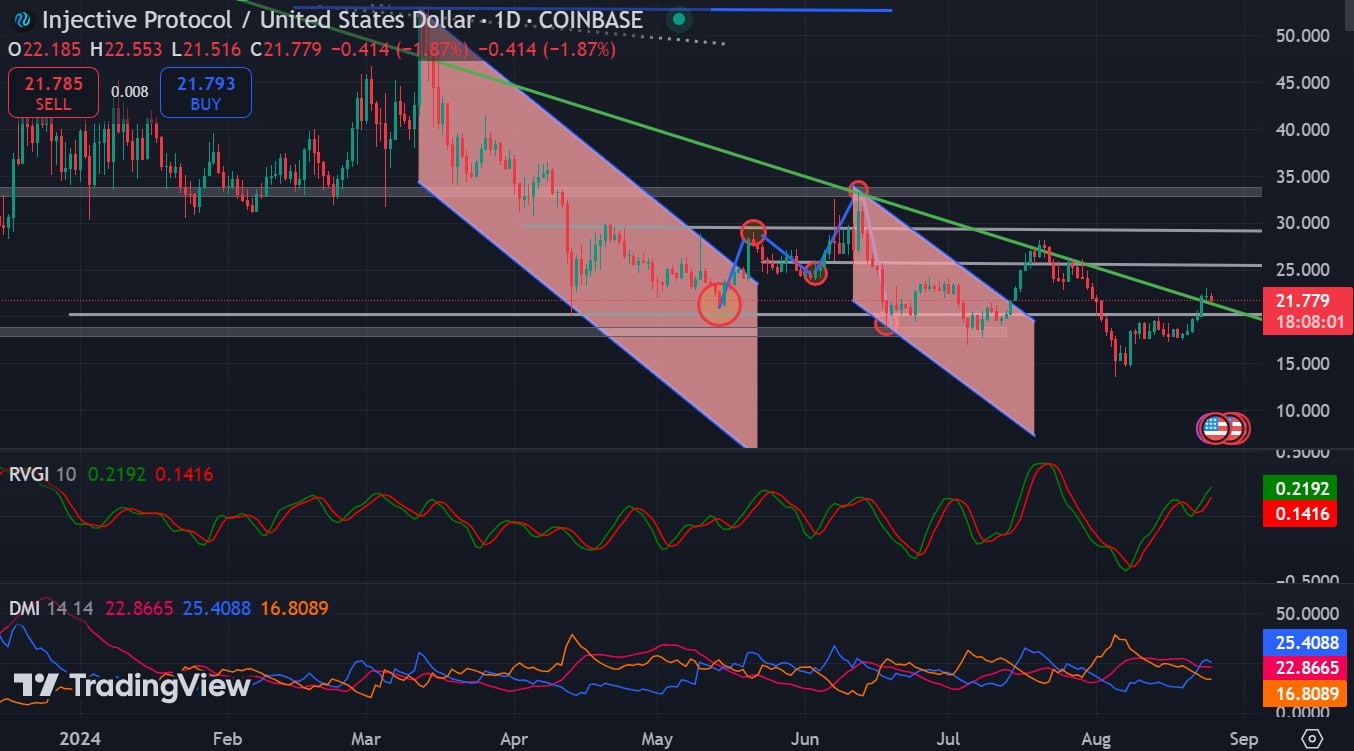
For starters, the Relative Vigor Index (RVGI) is positive at 0.219 above the signal line. This shows that the closing prices are higher than the opening prices suggesting there is upward market momentum.
This upward movement is further supported by the Directional Movement Index (DMI). At press time, the positive index of 25.4 is above the negative index of 22.8. This shows that the upward movement is relatively strong further.
Source: Coinglass
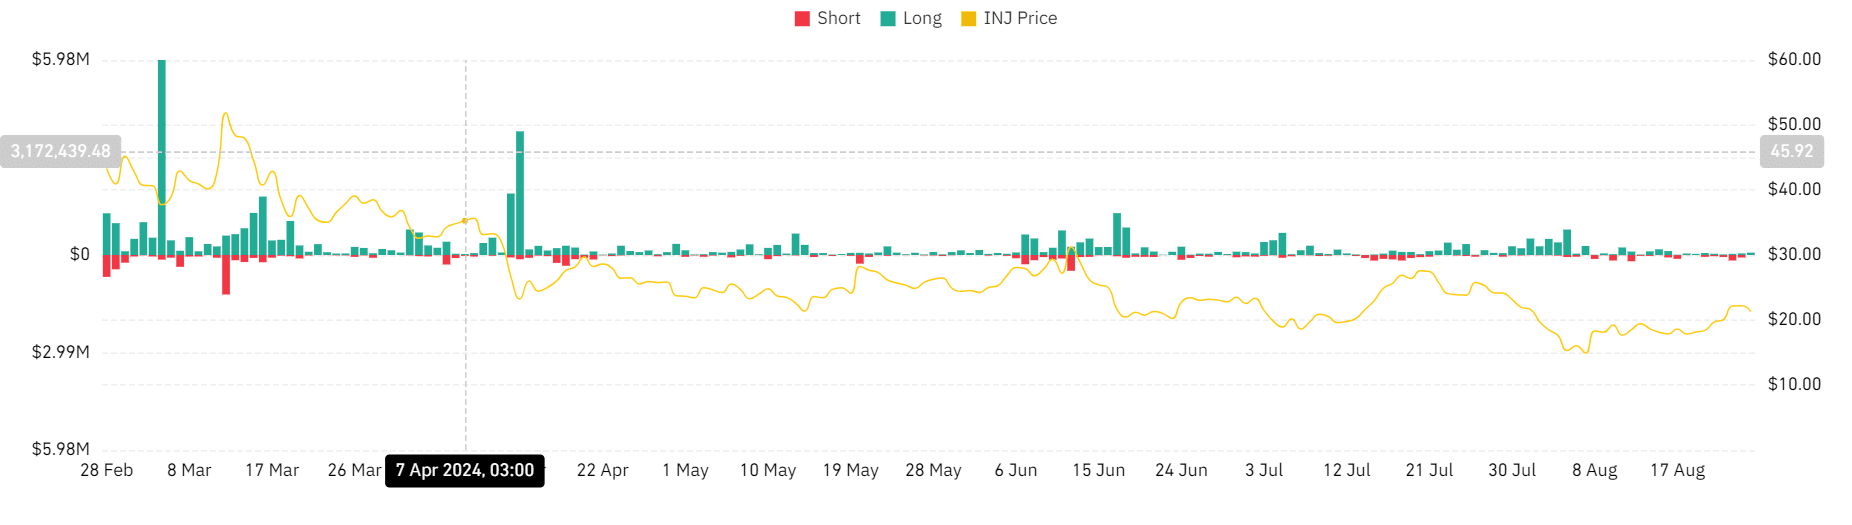
Looking further, AMBCrypto’s analysis of Coinglass shows long position liquidation has declined for the past 2 weeks. Since the August 5th market crash, long position liquidation has declined from $780k to $72k.
This shows that investors are confident with the altcoin’s future prospects and willing to pay a premium to hold their positions.
Source: Coinglass
Is your portfolio green? Check out the Injective Profit Calculator
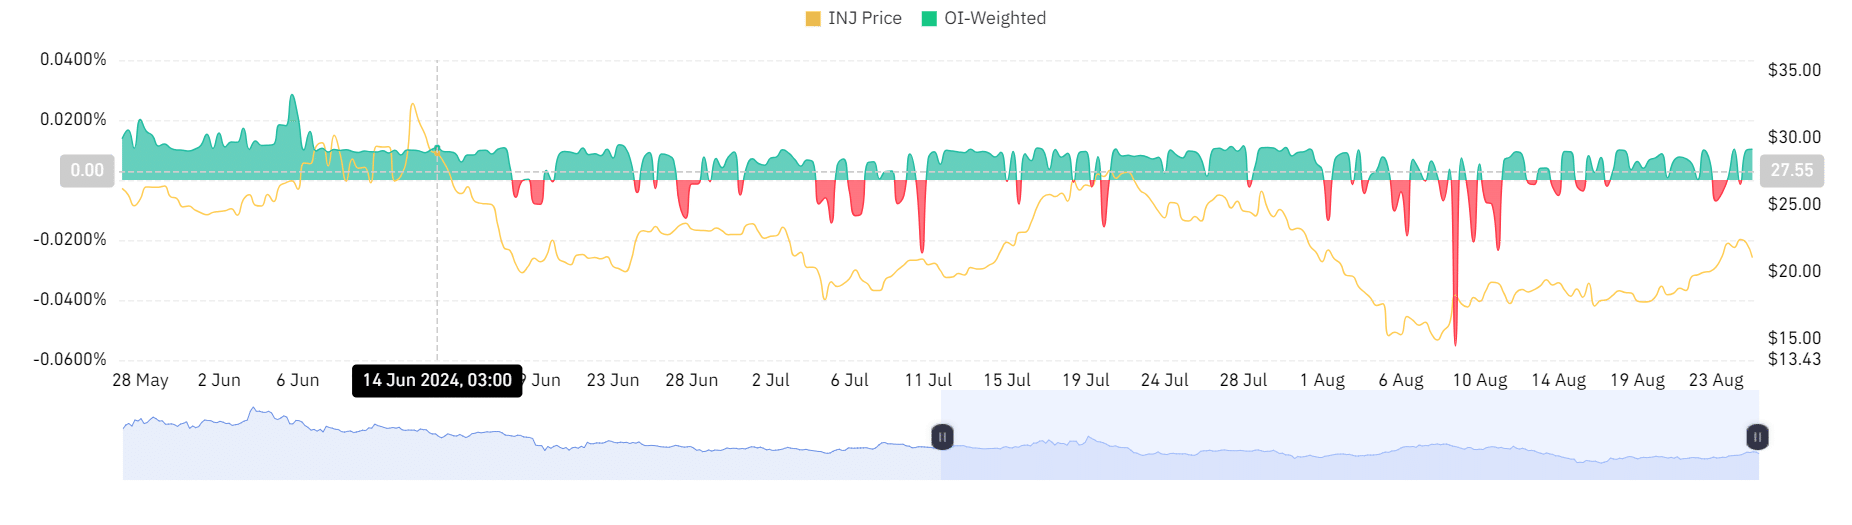
Equally, the altcoin’s OI-weighted funding rate is positive as of this writing. This shows that there is increased demand for long positions which is a bullish market sentiment.
Therefore, with a breakout from a descending channel, shows increased market favorability towards INJ. Thus if the current market conditions hold, the altcoin will challenge the next significant resistance level around $25.8 in the short term.