IOTA, Litecoin, Polkadot Price Analysis: 26 March

Many of the market’s altcoins share a high correlation with Bitcoin. At the time of writing, Bitcoin was being traded at $52,593 and saw a marginal price hike of over 0.3 percent in the past 24-hours.

Source: CoinStats
Altcoins like IOTA, Litecoin, and Polkadot have also seen the bearishness withdraw during the same time frame and are now inching upward on their respective price charts.
IOTA

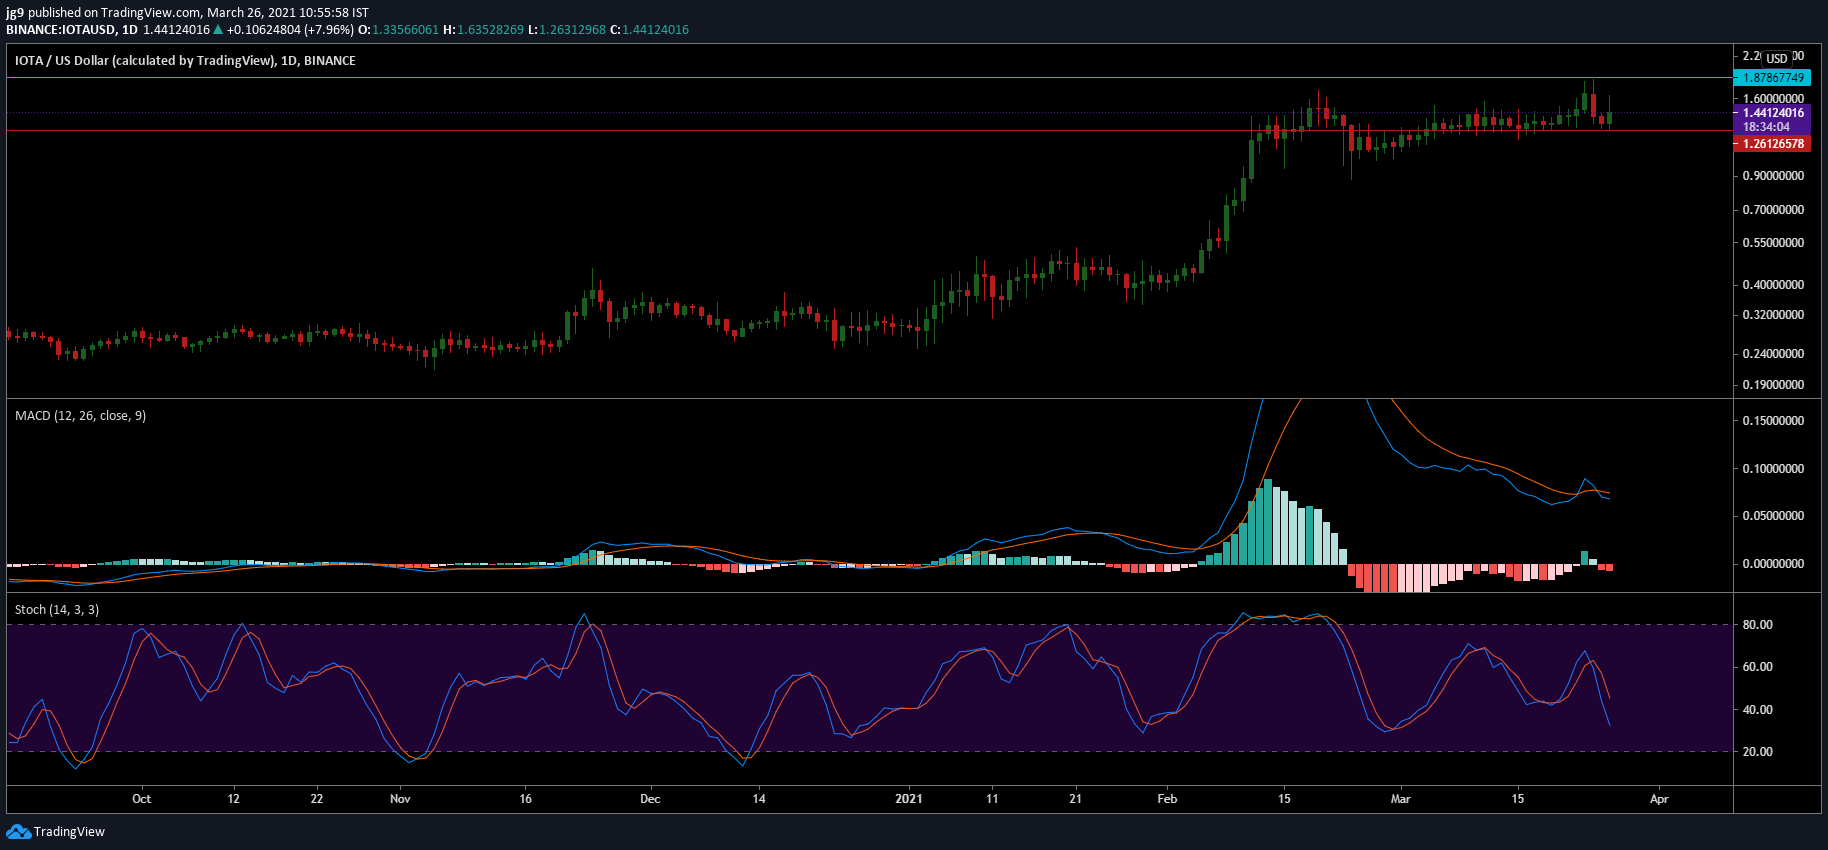
Source: IOTA/USD, TradingView
IOTA was trading at $1.44 and noted a market capitalization of over $4 billion. For the past few weeks, the coin traded mostly sideways and this trend seems to be changing at the time of writing. There is increased bullish momentum in IOTA’s market at the moment and the coin may head toward its immediate resistance around the $1.87 price range. The coin also has strong support that has been tried and tested multiple times at $1.26.
Technical indicators however looked bearish at the time of writing. MACD indicator underwent a bearish crossover and Stochastic indicator continued to fall well into the oversold zone. This could signal that a trend reversal was in the works and IOTA may witness a short-term price correction.
Litecoin [LTC]

Source: LTC/USD, TradingView
Litecoin is currently recovering from the strong bearish pressure it faced from 21-25 March. The coin was valued at $176 and has a market cap of over $11 billion. If the upward price action were to sustain, LTC would soon come in contact with resistance at $209, there is also another resistance around the $243 mark; however, it is unlikely that LTC will reach that price level in the coming week. There are also two strong supports at $162 and $137, if the bears were to take control once again.
MACD indicator underwent a bearish crossover and a reversal doesn’t seem likely in the short-term. RSI looked promising and is now moving away from the oversold zone and is currently in the neutral zone.
Polkadot [DOT]

Source: DOT/USD, TradingView
Polkadot currently occupies the 6th spot on CoinMarketCap’s list and was trading at $30.7. The current trading price of the coin is close to the support at $28.3 and if the price were to see a further price drop, then there is also adequate support around the 21.1 range. The past 24-hours saw DOT’s price increase by a marginal 1.7 percent and if the uptrend were to sustain then DOT may soon be faced with resistance around the $41.1 price range.
EMA ribbons have now settled just above the coin’s trading price and are likely to offer a bit of resistance toward its upwards price action. MACD indicator saw the signal line go past the MACD line registering a bearish crossover.


